Last week, I shared that we had been able to get our daughter (“Miss C”) a COVID-19 vaccination appointment for Sunday morning. She is one of the newly eligible five to eleven-year-old kiddos who began receiving vaccinations a week ago. Miss C’s appointment went perfectly, and she did not experience any side effects. More than a million kids just like her received shots this week, and it seems that her experience of no side effects might be more the norm for this age group based on NBC’s reporting. I share this to say, the vaccines are safe and effective and had no impact on my daughter’s weekend except for some treats as an acknowledgment of her bravery.
Beyond the excitement of so many new people getting vaccinated this week and the promise of more normal winter seasons for so many Missouri families, we have had an interesting week for COVID-19 data. Our statewide numbers began to spike after I sent out my last newsletter. Tonight’s newsletter digs into that spike and where we sit now. - Chris
COVID-19 by the Numbers
Total cases in MO: 884,064 (+7,461 from last Friday)
7-day average of new cases per day in MO: 1,065.86 (+45 from last Friday)
Counties with the highest per capita rates (per 100,000) of new cases per day this past week:
Atchison (59.64 per 100,000), Nodaway (54.49), Gasconade (46.5), Putnam (44.5), Clark (44.12), and Iron (41.93)
Total deaths in MO: 13,056 (+140 from last Friday)
7-day average of new deaths per day in MO: 20 (-2.86 from last Friday)
Percent of all Missourians initiating vaccination: at least 51% (no change from last Thursday)
Percent of all Missourians completing vaccination: at least 46% (no change from last Thursday)
Case and mortality numbers are current as of Thursday, November 11th. Vaccination numbers are current as of Friday, November 12th. Additional statistics, maps, and plots are available on my COVID-19 tracking site.
Trends in the Past Week
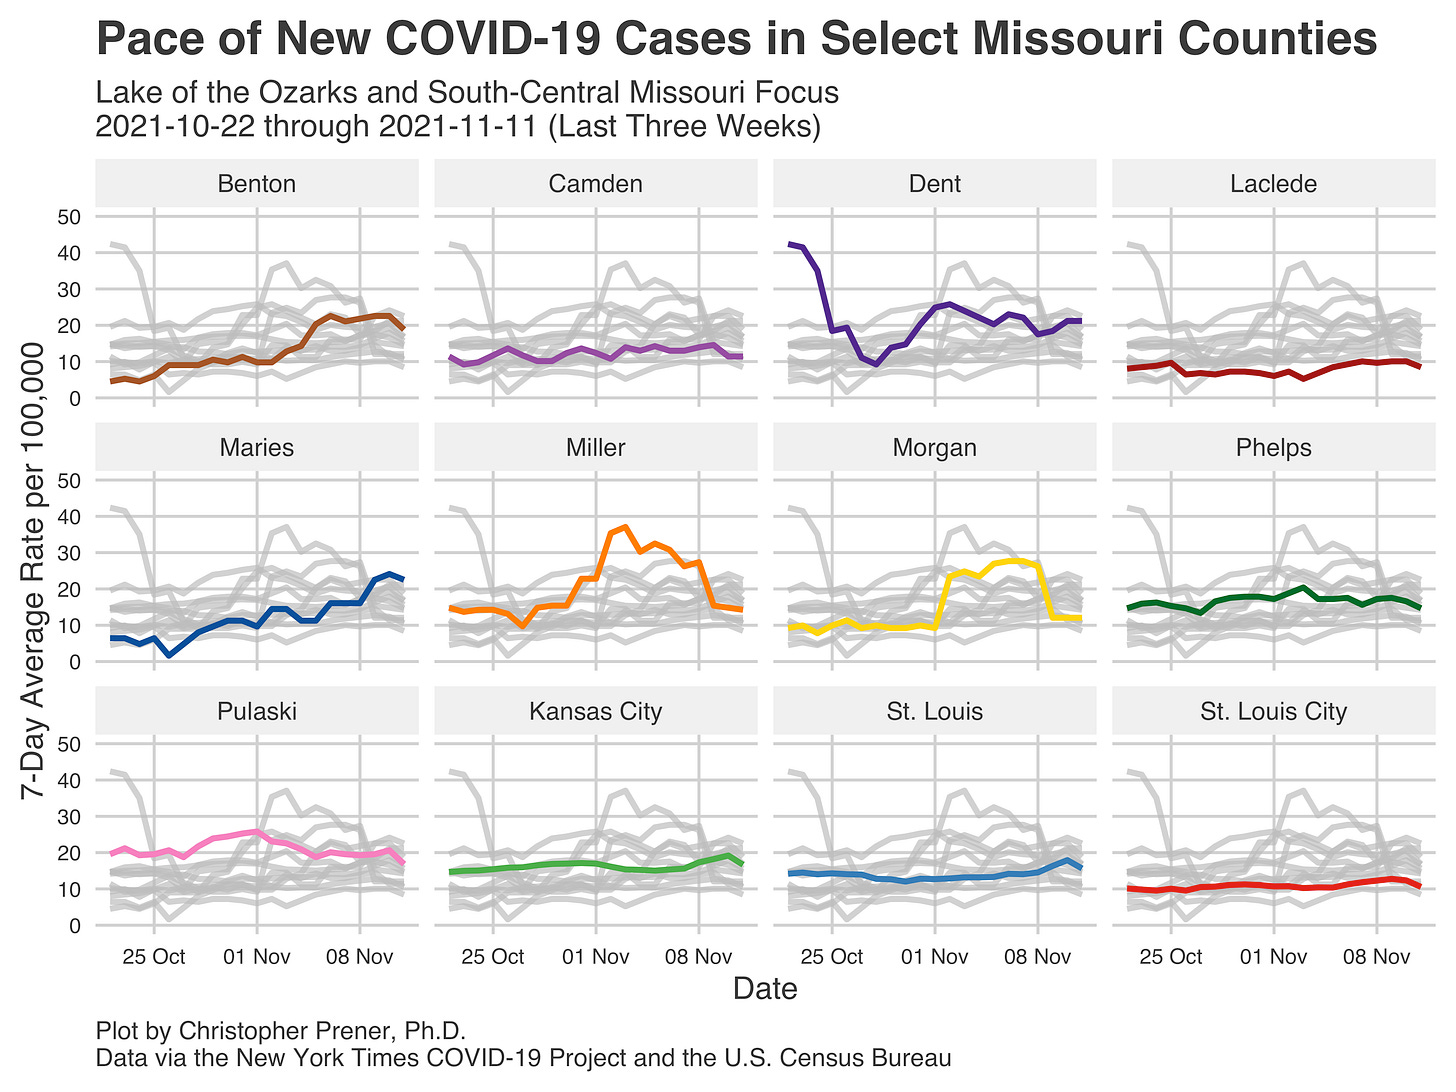
You can see the spike I referenced above right on the tail end of the trend lines below. Fortunately, it was brief, and our seven-day averages have reverted downward again to a degree. That said, there is still an overall upward trend from late October to where we are now. Furthermore, as the weather has become just a bit colder (there were snowflakes in the air in St. Lout. Lois today!), our numbers have begun to climb.
The good news so far is that the trend is unlike what we experienced at the beginning of November last year. That said, the risk of another significant upswing in COVID-19 cases over the next few months. The combination of cold weather-induced behavioral changes, like socializing and dining indoors, and family gatherings around the holidays create a perfect environment for increased case counts. Layer on the very mediocre to poor vaccination rates across Missouri counties, and you have a perfect recipe for growing spread.
However, what happened this past week may not entirely be a function of this overall growth. I am skeptical that the spike we saw this week is an actual increase in cases in every county. Instead, I wonder if it represents a human process related to COVID-19 testing or data processing in some jurisdictions.
First, the spike primarily unfolded in a couple of parts of Missouri - Mid-Missouri, Northwest Missouri, and Northeast Missouri. Second, what is striking over the past week is the spike began at the same time in all three regions, and several Mid-Missouri counties have the same table-like pattern in their data. For example, you can see it in Cole, Osage, and Morgan counties.
Over in St. Louis, there was an overall decrease on the last day of data reporting. However, this is undoubtedly due to minimal reporting due to yesterday’s Veteran’s Day holiday.
The upshot is that it is very challenging to tease out the signal in these trends from noise right now. So, again, I want to underscore that the patterns are suspicious to me, but I also do know for sure what is fundamentally driving these trends.
I also want to emphasize that I believe the overall upward trend is genuine. What we see in Gasconade and Maries counties above, for example, do not follow this suspicious pattern. Likewise, some of the highest rates are in Atchison and Nodaway counties in Northwest Missouri, where the pattern again looks different.
The real challenge will be that we will not have a “clean” seven-day average without the small numbers of cases reported on Veteran’s Day for a week. Then, a week after those seven-day averages return to “normal,” we are going to go through this again with Thanksgiving. I do begrudge local health departments for limiting data reporting during holidays. Staff have been working tirelessly for twenty months or more. However, limited reporting does have real implications for our ability to understand the broader trends at work precisely at a time when we have a greater risk of transmission because of those holidays.
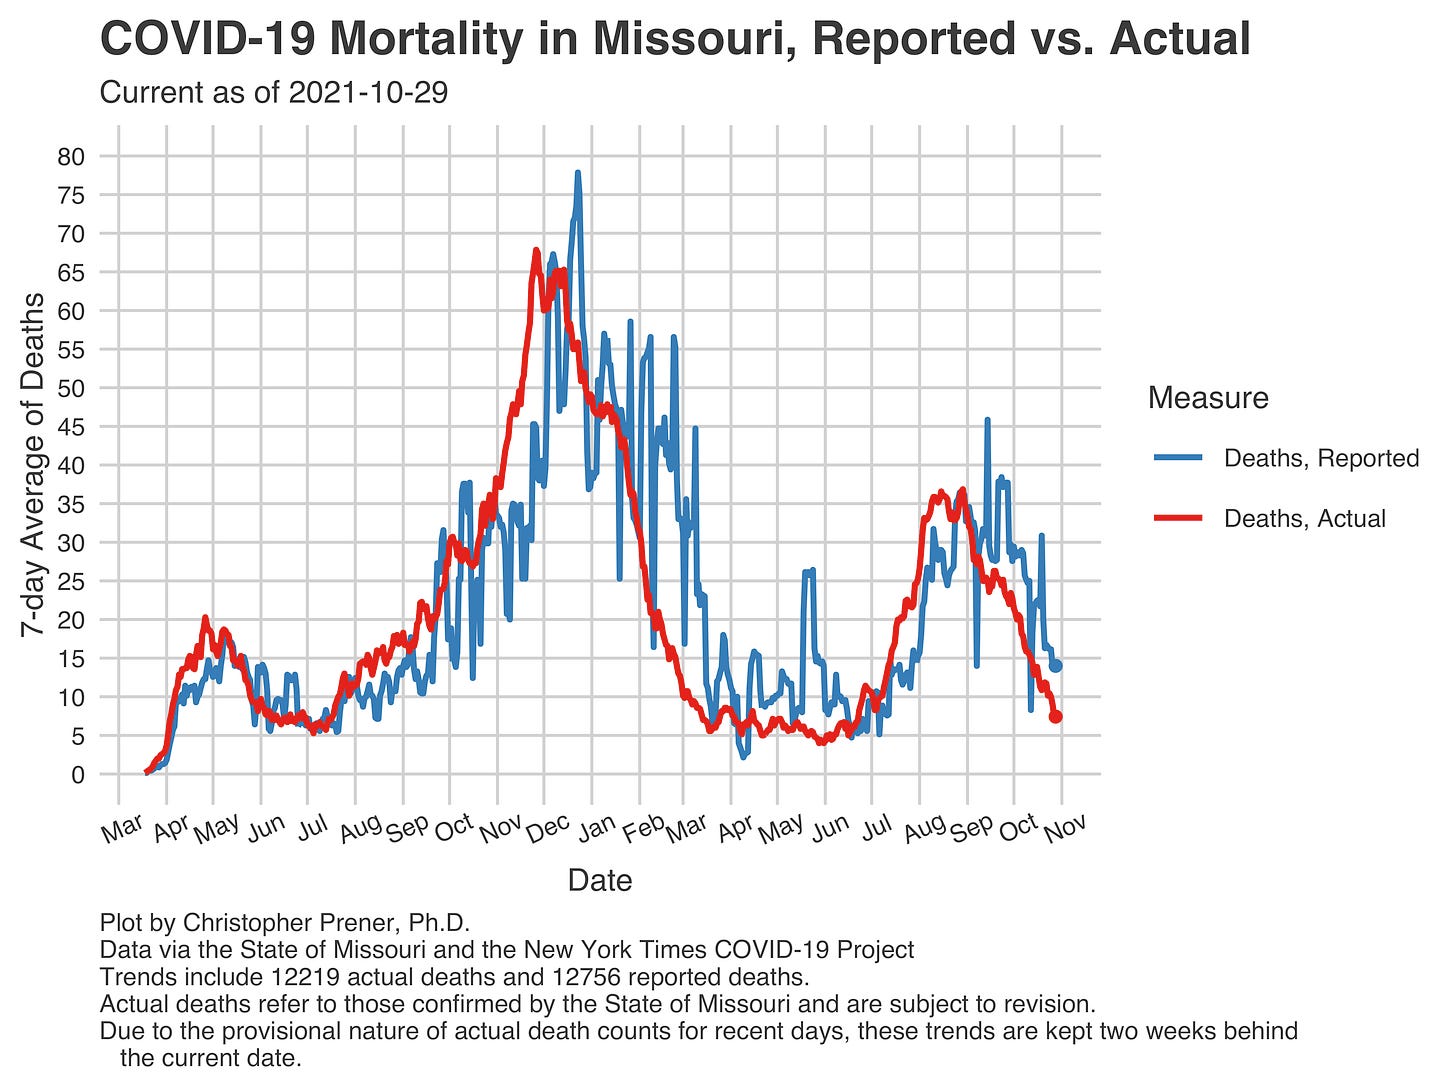
Those holidays will be much more difficult this year for many Missouri families. A year ago, we had experienced only 3,441 deaths cumulatively. By early March, when the dust settled on the holiday season last year, and the state had reported many of the deaths that occurred, we had a cumulative total of 8,571 deaths. This week, we crossed the 13,000 death mark. That means there are at least 4,5500 (or more) families whose loved one was present for the last holiday season who will not be around the table this year.
The very least we can do is understand that many of those deaths were preventable tragedies. Had we had different policies at the federal level, and in Missouri, we could very well have experienced fewer deaths this past summer. If we had more robust vaccination rates, we likewise could have had a different experience. To some extent, we can still control what happens in the next two to three months, but time is of the essence.


