I’m back after an extended break. To bring you up to speed: I wrote in my last newsletter on November 18th about a significant release of new case and death data from DHSS. This “data dump” affected my ability to use seven-day averages, which I rely heavily on, for the following week. The problem is that the “dump” of new cases was all attributed to the 18th, making it seem that COVID-19 spread was far worse that week than it was. A week out from the 18th was, of course, Thanksgiving. DHSS took four days off from public data reporting beginning Thanksgiving Day. That meant four days’ worth of new case data was reported on November 30th, again overstating seven-day averages. I have finally got to a point earlier this week where I could start reporting data again, and unfortunately, what I saw was a dramatic increase from the upturn I noted in my last newsletter. I’ll dive into those trends below. - Chris
COVID-19 by the Numbers
Total cases in MO: 945,190 (+19,621 from last Thursday)
7-day average of new cases per day in MO: 2,803 (+1,019 from last Thursday)
Counties with the highest per capita rates (per 100,000) of new cases per day this past week:
Worth (203.08 per 100,000), Gentry (195.05), Atchison (159.93), Harrison (146.97), Macon (114.26), Andrew (105.89), Nodaway (104.54), Monroe (97.4), and Clark (92.44)
Total deaths in MO: 15,667 (+126 from last Thursday)
7-day average of new deaths per day in MO: 18 (+4.43 from last Thursday)
Percent of all Missourians initiating vaccination: at least 52% (+2% from three weeks ago)
Percent of all Missourians completing vaccination: at least 48% (+2% from three weeks ago)
Case and mortality numbers are current as of Wednesday, December 8th. Vaccination numbers are current as of Thursday, December 9th. Additional statistics, maps, and plots are available on my COVID-19 tracking site.
Trends in the Past Week
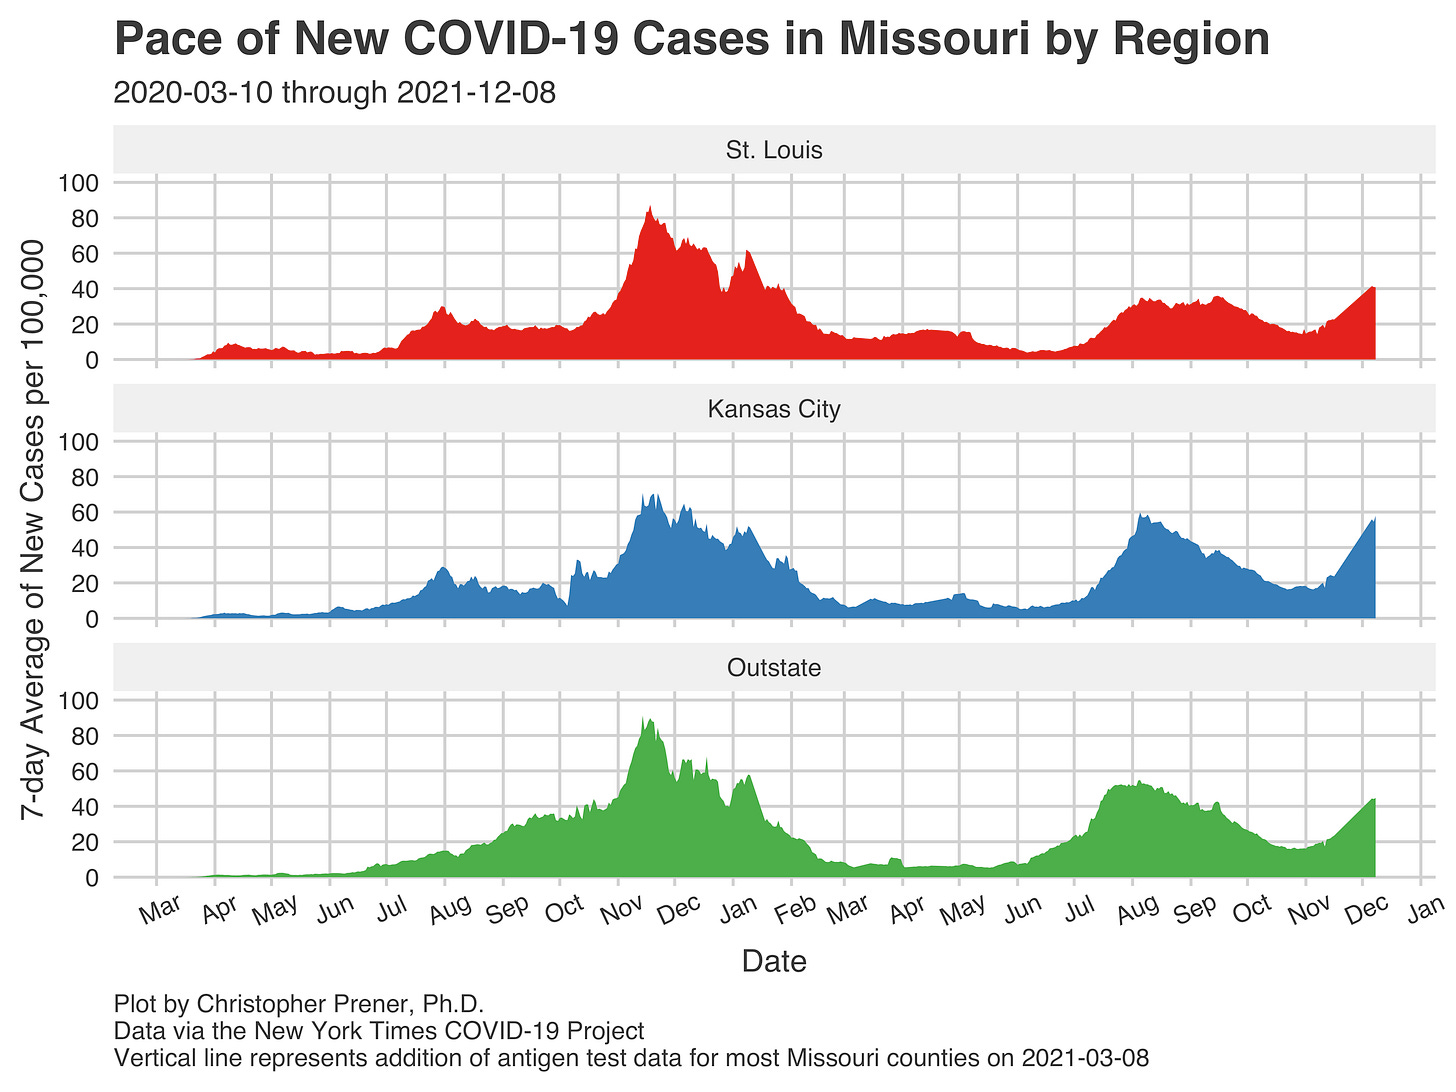
During the several-week period we lacked precise seven-day averages, COVID spread grew dramatically in Missouri. The spike we are experiencing rivals our summer surge in cases. Things are worst in the Kansas City area, where rates are approaching sixty new cases per 100,000 people per day. In St. Louis, rates are about 40 new cases per 100,000 people. Substantially lower, yes, but higher than at any point since January 2021.
The “Outstate” trend is deceiving because there are pockets, especially in Northern Missouri, where case rates are rising dramatically. In contrast, things are looking best in Missouri’s “Bootheel” area right now.
Counties in the St. Joseph area in particular are experiencing rates surpass prior all-time highs. Andrew, Atchison, Gentry, Harrison, Nodaway, and Worth counties all fit this description.
Just a bit to the east, the patterns are similar in Adair, Macon, Mercer, Putnam, Randolph, and Schuyler counties. That said, rates are lower there and more representative of what we see across much of Northern Missouri.
That is until we get to the Kansas City area. In both the formal Kansas City metropolitan area and the counties just to the east, along the I-70 corridor, we see new case rates surpassing the summer wave earlier in 2021. These rates are why this part of Missouri is currently under some of the most pressure. Of particular note is a pattern playing out in St. Louis as well - the core urban counties in Kansas City, especially Jackson and the city itself, have the lowest case rates. However, rural counties, like Clinton, Ray, Carroll, and Saline, are bearing a much bigger brunt of cases.
Even in areas that seem to be doing pretty well, there is a modest increase in new cases. This phenomenon is true in the Bootheel (not pictured) and Springfield, where case rates are not close to their peaks during prior waves but are visibly increasing.
Meanwhile, hospitals are beginning to fill again. Statewide, this was evident at the end of November, with modest but still notable increases in new in-patient numbers across all of our metros.
More up-to-date data is available for the St. Louis area, where in-patient numbers (and all three of the other metrics I track closely) are trending upward. Unfortunately, this is a recipe for a very challenging holiday season that will be marred by more data black-outs when DHSS slows down data reporting.
At the same time, we are facing several unknowns. Globally, we are waiting for better data on just how transmissible the Omicron variant is (remarkably, it seems), how sick it makes people (perhaps less so, but perhaps not), and how it impacts kids (a big concern).
Closer to home, a judge’s ruling that invalidated county mask mandates around Missouri is reverberating in several ways. First, counties like St. Louis County have had to end their mask mandates. Second, our Attorney General is pressuring school districts to drop their mask mandates for students, faculty, and staff, despite the overwhelming evidence that masks are effective and contribute to keeping kids in classrooms where we want them to be. Third, there is a lack of clarity from DHSS on how the ruling impacts local health department operations. As a result, several have suspended orders for masking, isolation, and quarantine. In addition, some have halted essential functions like contact tracing, case investigation, and public data reporting.
The timing for this could not be worse. Our cases are rising. Hospitalizations are rising. Last year’s period in November and December was the highest transmission period of the year, with holiday gatherings contributing to the substantial peak we experienced. Waning vaccine effectiveness now means that many “fully vaccinated” people have a false sense of security. We are flying increasingly blind into this storm because our local health departments may find themselves stripped of any authority to address the pandemic meaningfully. This is a potentially disasterous situation for already burned-out hospital staff, first responders, and educators. We owe them so much more than what Missouri is providing tonight.


