It feels strange to say, but in some ways, it feels like is not much to say this week. Case rates and hospitalizations are abysmal in Missouri right now. Worst of the pandemic bad. The hospitalization numbers we see here in St. Louis (which I describe below) and nationally are not sustainable. Reporting locally from Michele Munz and nationally from Ed Yong clarifies just how dire the situation in our hospitals is right now.
Locally, I am looking for signs that hospitals have run out of staffed beds, are using overflow spaces to house patients, and are implementing crisis standards of care. Munz described these last year - they provide a scoring system to rank patients based on indicators like their age and medical history when there are not enough resources to go around.
The consequences of these shifts would mean higher mortality rates from COVID and other causes because hospital systems lack the resources they need to provide timely patient care for all who need it. Moreover, providers’ burnout will only increase, as Yong points out when he reminds readers that this spike is happening after so many challenging months have already elapsed. In other words, many providers’ gas tanks were running on fumes before the latest surge.
We must bring all the evidence-based tools at our we have at our disposal to bear on this: from masking (including free, high-quality masks for all) to increased testing access, paid sick leave, and mitigation measures in high-risk venues like restaurants, gyms, and other businesses. - Chris
COVID-19 by the Numbers
Total cases in MO: 1,083,838 (+61,367 from last Friday)
7-day average of new cases per day in MO: 8,766.71 (+4,287.57 from last Thursday)
Counties with the highest per capita rates (per 100,000) of new cases per day this past week:
St. Charles (256.93 per 100,000), St. Louis (230.62), Kansas City (201.25), St. Louis City (201.2), Jackson (167.2), Jefferson (156.03), Lincoln (155.29), Clay (138.55), Cass (137.78), and Warren (136.08)
Total deaths in MO: 16,478 (+255 from last Thursday)
7-day average of new deaths per day in MO: 36.43 (+7.71 from last Thursday)
Percent of all Missourians initiating vaccination: at least 56% (no change from last week)
Percent of all Missourians completing vaccination: at least 50% (no change from last week)
Case and mortality numbers are current as of Thursday, January 6th. Vaccination numbers are current as of Friday, January 7th. Additional statistics, maps, and plots are available on my COVID-19 tracking site.
Trends in the Past Week
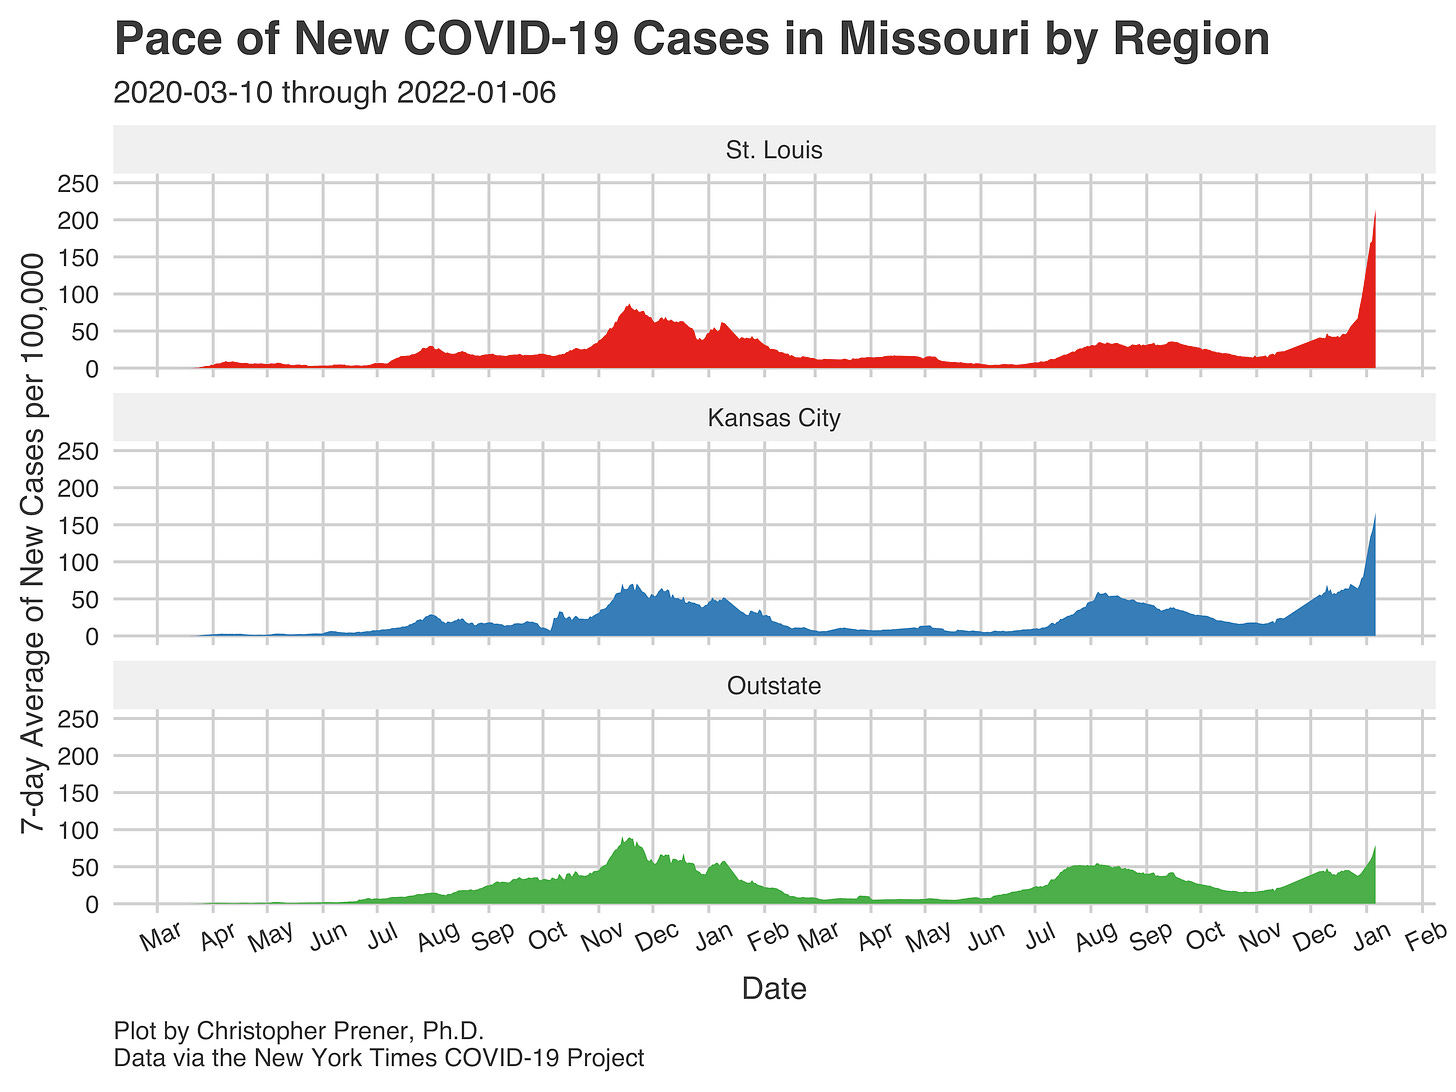
Suppose you compare the plot below to the same one that led off last week’s newsletter. In that case, the difference is striking - the dagger-like trends in St. Louis and Kansas City have grown significantly, “Outstate” now has a recognizable surge beyond its December numbers. As a result, I have had to expand the y-axis’s top-level from 100 to 250 to accommodate the growth in new cases.
I want to start in “Outstate” Missouri because I worry that we are repeating one of the critical failures of the pandemic’s very first wave - assuming that the surge in new cases is limited to our two biggest cities. Every metro area is now experiencing an evident, steep surge indicative of the patterns already established in St. Louis and Kansas City. Columbia now has the highest rate of new cases for any point in the pandemic. St. Joseph is just below its all-time high (its peak was 108.29 new cases per 100,000 in November 2020, right now, its value is 107.72). Both Springfield and Joplin also seem to be closing in on record numbers of reported cases.
In Mid-Missouri (home to the Columbia and Jefferson City metros), Boone and Montgomery counties have set an all-time high, and Cole County is seeing a sharp uptick in its new case rate.
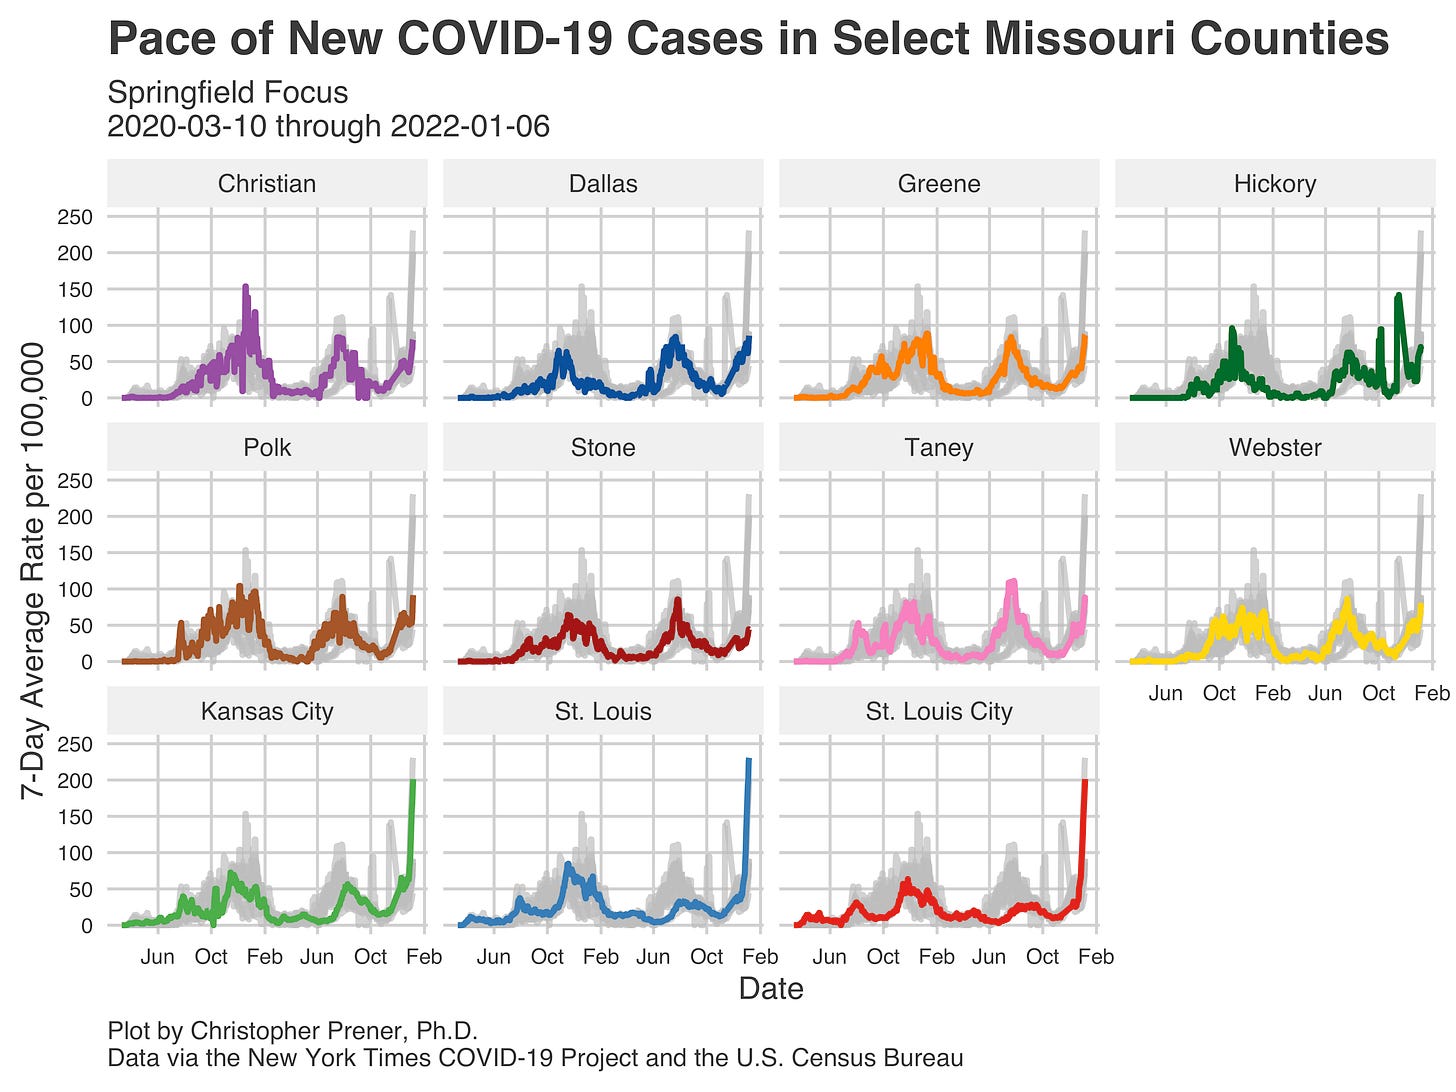
It is also not just hitting the most urban parts of our metro areas. Take the Springfield metro, where several counties seem poised to outrun their prior all-time highs, including Dallas, Polk, Taney, and Webster counties.
In Southeast Missouri, Dunklin County has set an all-time high, and other counties (including New Madrid and Pemiscot) are seeing sharp increases in new case rates.
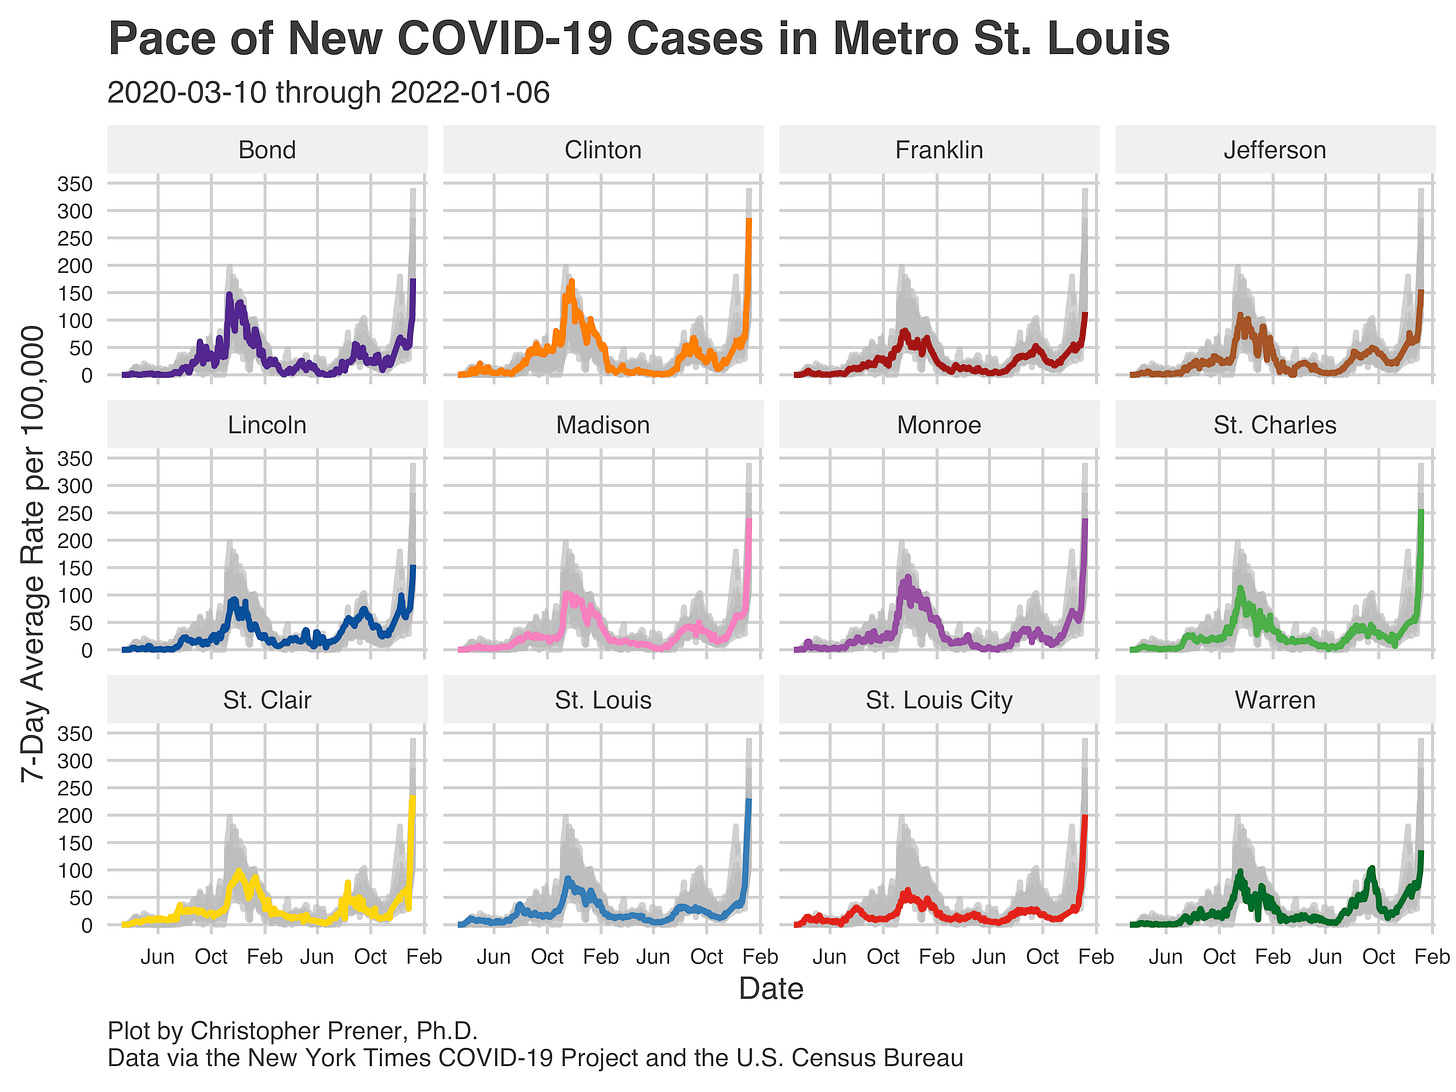
These spikes, emphatically, are not just a situation facing our two larges cities (though it is most severe there). However, the situation is undoubtedly most precarious in both metros. For example, in Kansas City, every county I track most closely except Clinton is experiencing all-time high rates of new cases. Clinton County is below its highs from the past two months, but its current rate of new cases is higher than at any point before November 2021.
St. Louis looks much the same, with every county displaying the same characteristic sharp increase to all-time highs. Of the Missouri counties, St. Charles County has the highest rate of new cases.
Longtime readers will know that St. Louis’s Pandemic Task Force providers the most comprehensive and up-to-date hospitalization data in Missouri. Our seven-day average has blown past its prior high from the fall-winter ‘20-’21 surge. In addition, the one-day number of confirmed and suspected COVID-19 patients has surpassed 1,250, over 200 patients higher than the prior one-day high.
Pediatric patients are now at the highest numbers reported in St. Louis since the Task Force began reporting data specifically on children in August.
These hospitalization increases come on the heels of already growing rates throughout December. You can see the upswings in hospitalizations as of Christmas Eve in every single metro in Missouri.
There is perhaps one small bright spot to share tonight: the falling ratio of ICU and mechanically ventilated patients. The share of ICU patients out of all COVID-19 patients is now at its lowest point of the pandemic.
However, I want to be very, very cautious with this interpretation. There is a lag between patients being omitted to hospitals and requiring ICU care, and we may see this trend shift. However, it is stark compared to the ratio during our Delta surge this summer and fall. It also fits with patterns we see in South Africa and the United Kingdom. We will watch this trend closely over the next few weeks.


Thank you for all the continued hard work you’ve done to keep us updated. This has become an essential resource in my weekly Covid round up. Best to you and your family. You are truly invaluable to the community.