For most of today, it felt like COVID receded into the background because of the awful news from Ukraine. COVID is still here, unfortunately, though it is far less present in Missouri communities than it was even a week or two ago. These declines in Missouri and elsewhere are part of the inspiration behind an expected change in CDC guidance around masking tomorrow. We don’t know the full scope of the recommendations yet, nor do we know how they would impact federal mandates for masking on school busses and airlines, among other venues.
My honest assessment is that this is more about politics than public health. Leading voices in public health responded to the blatant misinformation from the “Urgency of Normal” group with a call for continued masking, including in schools. I encourage you to check out their evidence and information.
The real question for me is whether we are making this move away from masking too soon (I believe that we are) and how we will communicate what a future on-ramp will look like (I don’t know that anyone will). I find it particularly problematic that our new vaccination rates have bottomed out. Without substantial increases in vaccination rates and far new non-pharmaceutical interventions in play, we risk seeing our progress slow or even reverse itself in the short term.
Moving away from masking is just one part of the slow march away from the pandemic I see. Missouri has stopped providing data updates on the weekend, and I anticipate seeing reductions in data availability over the next few months as jurisdictions pivot towards “normal” operations. Again, I suspect that we are making this move too soon, but the practical impact will be that I will have less to report.
To start, I will not be updating the website on Sundays or Mondays anymore (since my data are a day behind the State’s data releases). Those website updates will continue until May 7th (26 months from Missouri’s first COVID case), at which time I’ll convert the website into an archive of COVID data. I’m anticipating putting River City Data on a hiatus at that point. Until then, though, I plan to continue these weekly updates. - Chris
COVID-19 by the Numbers
Total cases in MO: 1,409,221 (+8,167 from last Thursday)
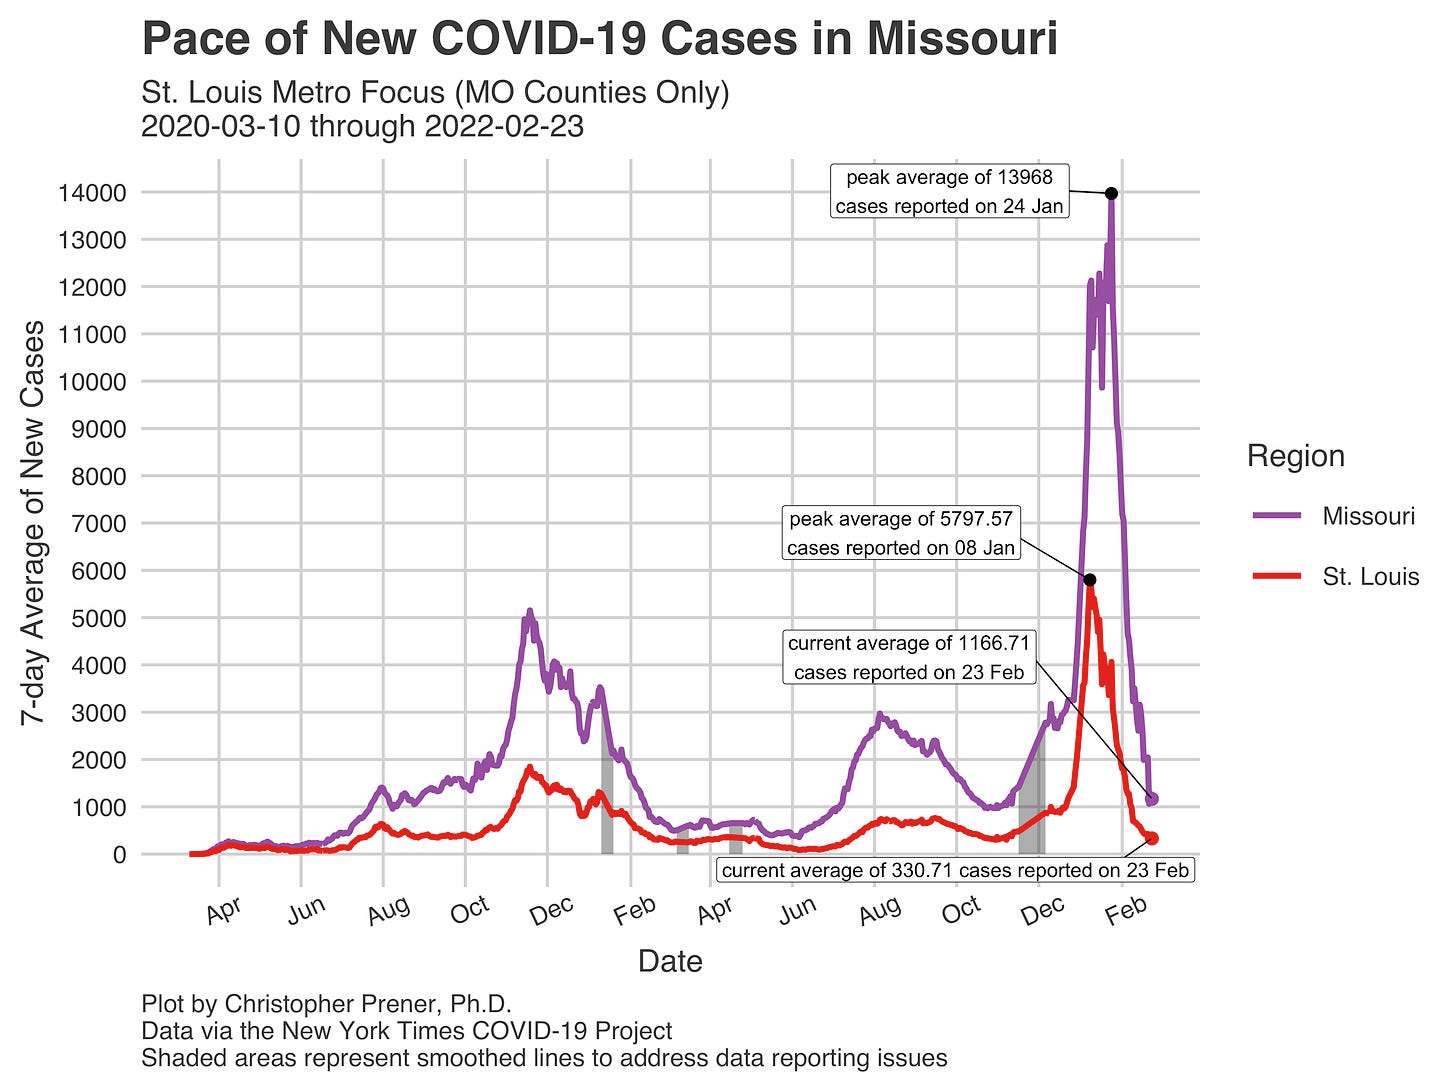
7-day average of new cases per day in MO: 1,166.71 (-1,444.71 from last Thursday)
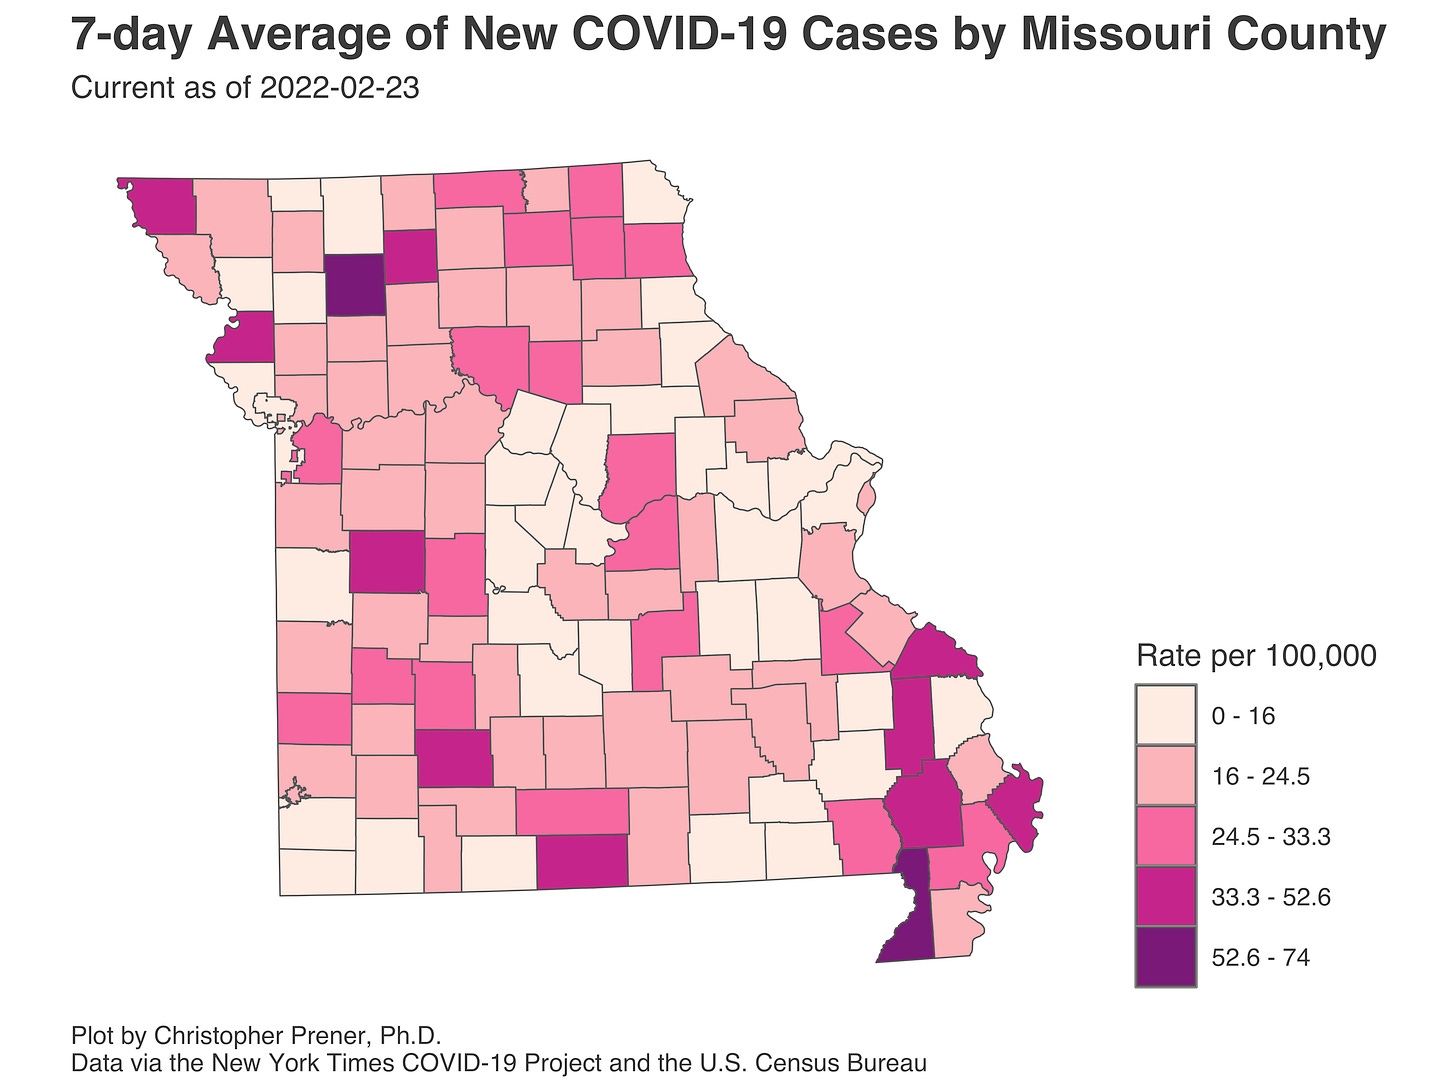
Counties with the highest per capita rates (per 100,000) of new cases per day this past week:
Daviess (73.99 per 100,000), Dunklin (62.44), Grundy (42.69), Stoddard (42.6), Bollinger (41.88), Mississippi (41.56), and Atchison (40.66)
Total deaths in MO: 18,649 (+100 from last Thursday)
7-day average of new deaths per day in MO: 14.29 (-36.86 from last Thursday)
Percent of all Missourians initiating vaccination: at least 58% (no change in previous two weeks)
Percent of all Missourians completing vaccination: at least 52% (no change in previous two weeks)
Case and mortality numbers are current as of Wednesday, February 23rd. Vaccination numbers are current as of Thursday, February 24th. Additional statistics, maps, and plots are available on my COVID-19 tracking site.
Trends in the Past Week
The declines in new cases are striking. For example, in St. Louis, we dropped from an average of nearly 5,800 new cases on January 8th to just 300 new cases on average in seven weeks. Likewise, Missouri statewide numbers have fallen from an average of 14,000 new cases to less than 1,200 in four weeks and a few days.
One cautionary note in these data is how the declines have slowed, especially in St. Louis. It is important to remember that the drops and whatever comes next are not inevitable. Rates are especially low in St. Louis and parts of Mid-Missouri. On the flip side, rates are notably high in Southeast Missouri and the Bootheel. Those notably high rates, though, are so much lower than they were two or three weeks ago. Even just last week, Atchison County’s rate in the northwest was twice the highest rate today in Dunklin County.
Some of the rates in Southeast Missouri have come up a bit in the last week or so. However, I would hesitate to characterize these as a spike. Instead, they seem to be broad plateaus at rates that are just a bit higher than recent lows.
Our recent hospitalizations data statewide show that the declines are broader than just new cases. Rates of COVID patients have dropped substantially as of February 11th in every metro area, with the least progress in Southwest Missouri. That’s not especially surprising, given that they peaked a few weeks later there than elsewhere in Missouri.
The more recent hospitalization in St. Louis show very steep continued declines in our in-patient census. Other metrics reflect this same pattern, including both in critically ill adult patients and pediatric hospitalization numbers. Therefore, I would not be surprised to reach hospitalization rates similar to early July in the next week or two.
Finally, we got another revision of our mortality data statewide. While the recent data remains wildly inaccurate (far too low), our peak in January has been revised upward again to nearly 65 deaths per day on average near the end of the month. As I have previously indicated, I do not think this will be the end of these revisions. The Omicron wave has brought an incredible amount of pain to many families in Missouri who lost loved ones between Thanksgiving and Valentine’s Day. While deaths are proportionally lower in this latest surge, there have been so many infections that we have experienced the second-worst spike in pandemic deaths.


