We’ve got a short one tonight because there is not that much to report. Overall, things look OK relative to where we were a couple of weeks ago. At the same time, they’re still quite bad relative to much of the pandemic. These data aren’t stopping a small cottage industry of “it’s time to move on” op-eds, hot takes, and pronouncements, though. Focus on hospitalizations as you consider whether those are well-informed takes, and then go and read Ed Yong’s latest in The Atlantic. Hospital staffing is more precarious than any point prior in the pandemic: providers are fewer in number and more burned out than they were the last time hospitalizations were as high as they are right now. I fear we’re still a long way from normal. - Chris
COVID-19 by the Numbers
Total cases in MO: 1,360,166 (+49,352 from last Thursday)
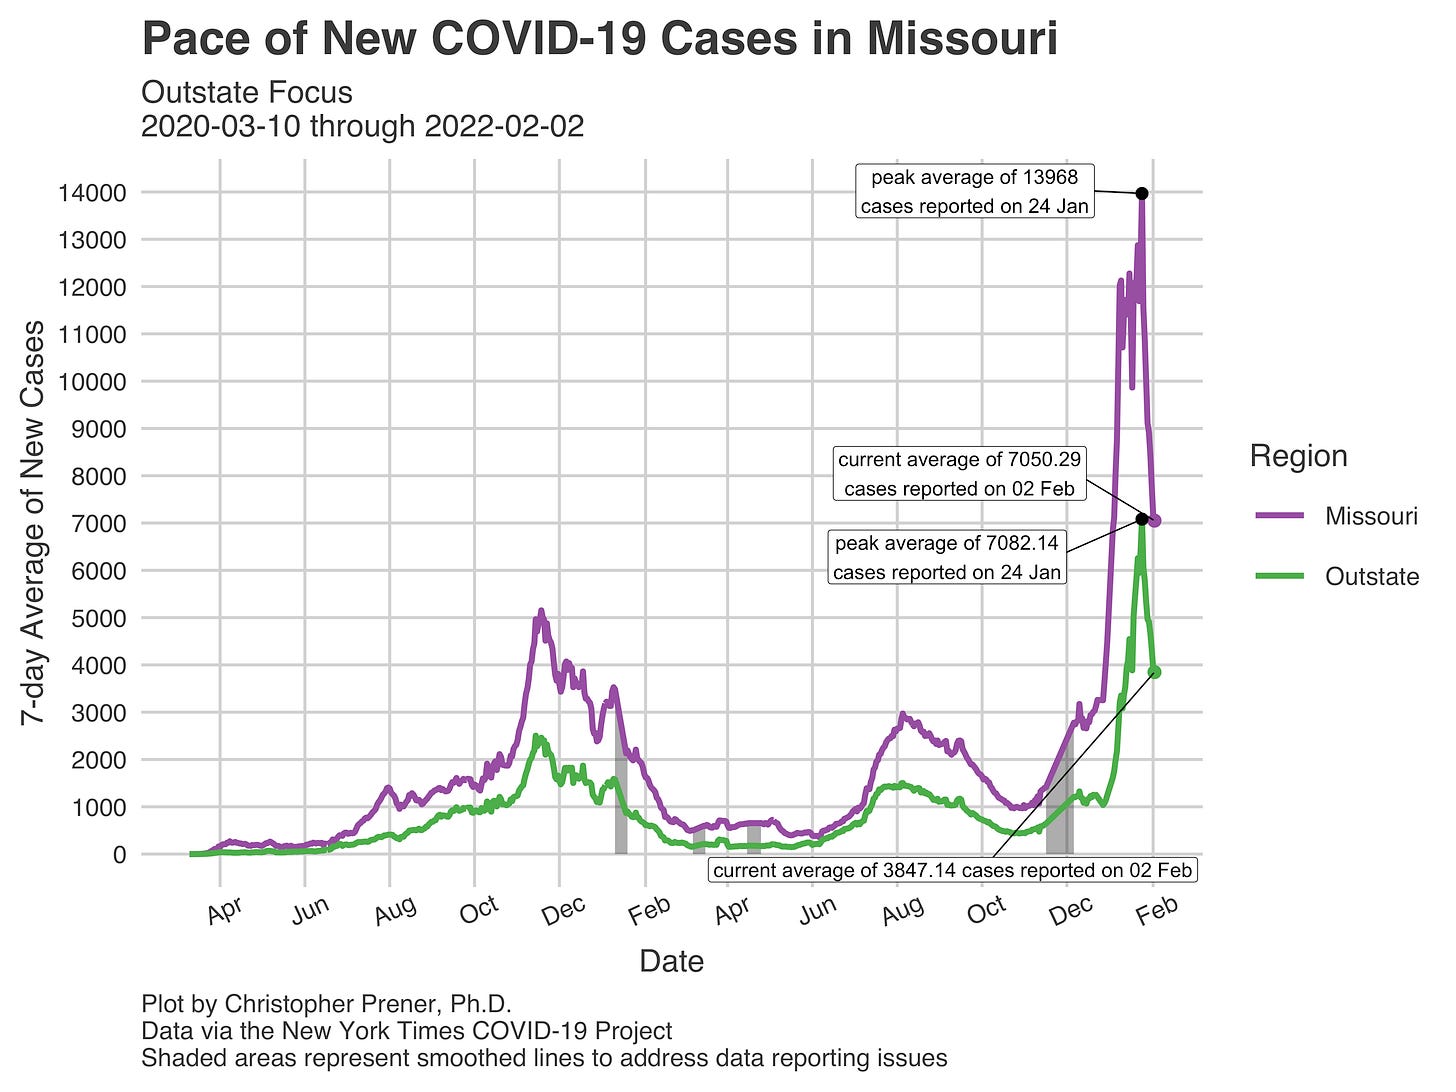
7-day average of new cases per day in MO: 7,050.29 (-3,828.71 from last Thursday)
Counties with the highest per capita rates (per 100,000) of new cases per day this past week:
Atchison (276.5 per 100,000), St. Francois (235.15), New Madrid (226.99), Lewis (220.83), St. Clair (211.63), Madison (196.64), Pettis (196.23), Adair (183.33), and Henry (180.5)
Total deaths in MO: 17,807 (+462 from last Thursday)
7-day average of new deaths per day in MO: 66 (+16.14 from last Thursday)
Percent of all Missourians initiating vaccination: at least 57% (no change for last three weeks)
Percent of all Missourians completing vaccination: at least 51% (no change for last three weeks)
Case and mortality numbers are current as of Wednesday, February 2nd. Vaccination numbers are current as of Thursday, February 3rd. Additional statistics, maps, and plots are available on my COVID-19 tracking site.
Trends in the Past Week
Our top-level numbers look downright fantastic compared to two weeks ago. For example, Missouri has dropped from a daily average of nearly 14,000 new cases to half that number in just ten days. St. Louis is averaging less than a third of the new cases it was at the beginning of January.
Rates in Outstate Missouri (all counties not in St. Louis or Kansas City) are still quite a bit higher than in St. Louis. However, they have still improved quite a bit with a drop of nearly fifty percent from their high.
The pockets of high rates are broadly in three areas of the state right now - in parts of Southeastern Missouri, across a large swath of counties from 44 north to 70 from Springfield north to Carroll County, and then in Northeastern MO. In all of these areas, cases are falling. The two exceptions are New Madrid County in the Bootheel and Atchison County in extreme Northwestern MO. After a week of declines, New Madrid had had just a slight uptick, and Atchison County has plateaued.
But, and this is a big caveat, things are only good relative to a few weeks ago. Look at Outstate, for example. Rates have improved significantly, as I noted above, but they are still higher than their prior peak way back in November ‘20 by a significant margin. So this is the critical takeaway - yes, cases are falling, which is excellent. But they are still very, very high.
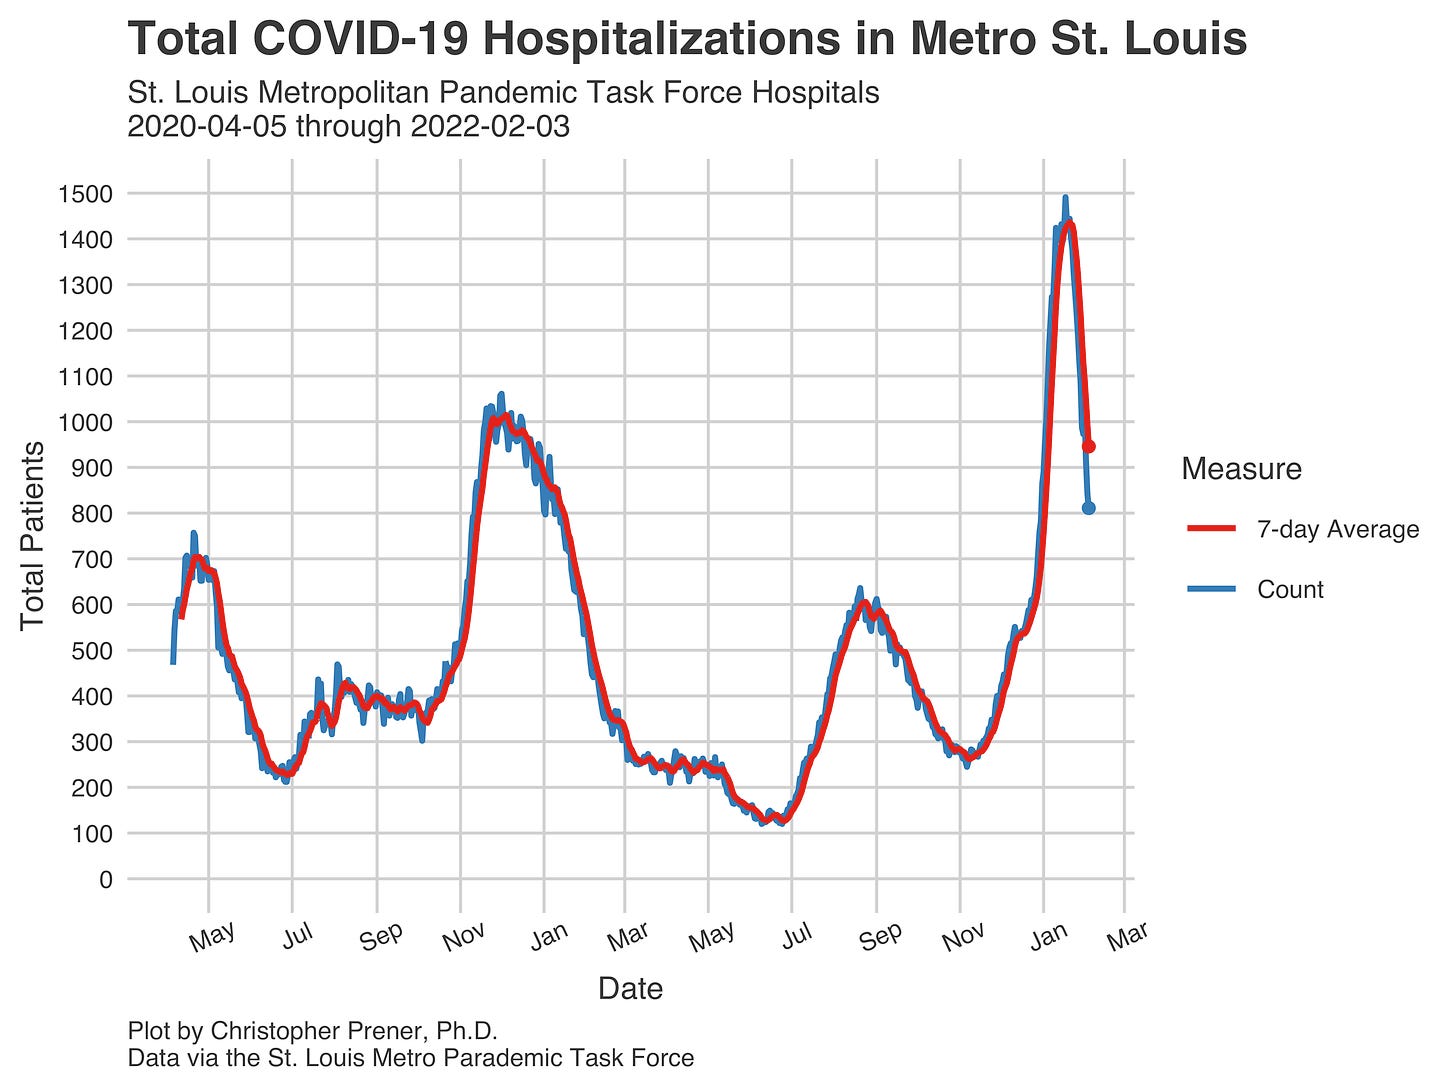
Where it is crucial is in our hospitals. Our metro-level data show signs of potential peaks in four areas - Columbia, Jefferson City, Kansas City, and St. Louis. However, as of January 21st, they were still climbing in our other four metro areas.
In St. Louis, where our data are up-to-date, you can see how things have improved since that peak. Again, however, the improvement is only relative to the surge we just experienced. Our hospitalizations are still higher than at any other point except for the worst part of the November-January ‘20-‘21 surge.
The same is true with ICU numbers, which are worse than they have been except for two prior periods - the first weeks of the pandemic and the November surge that was our worst point in the pandemic before this past month.
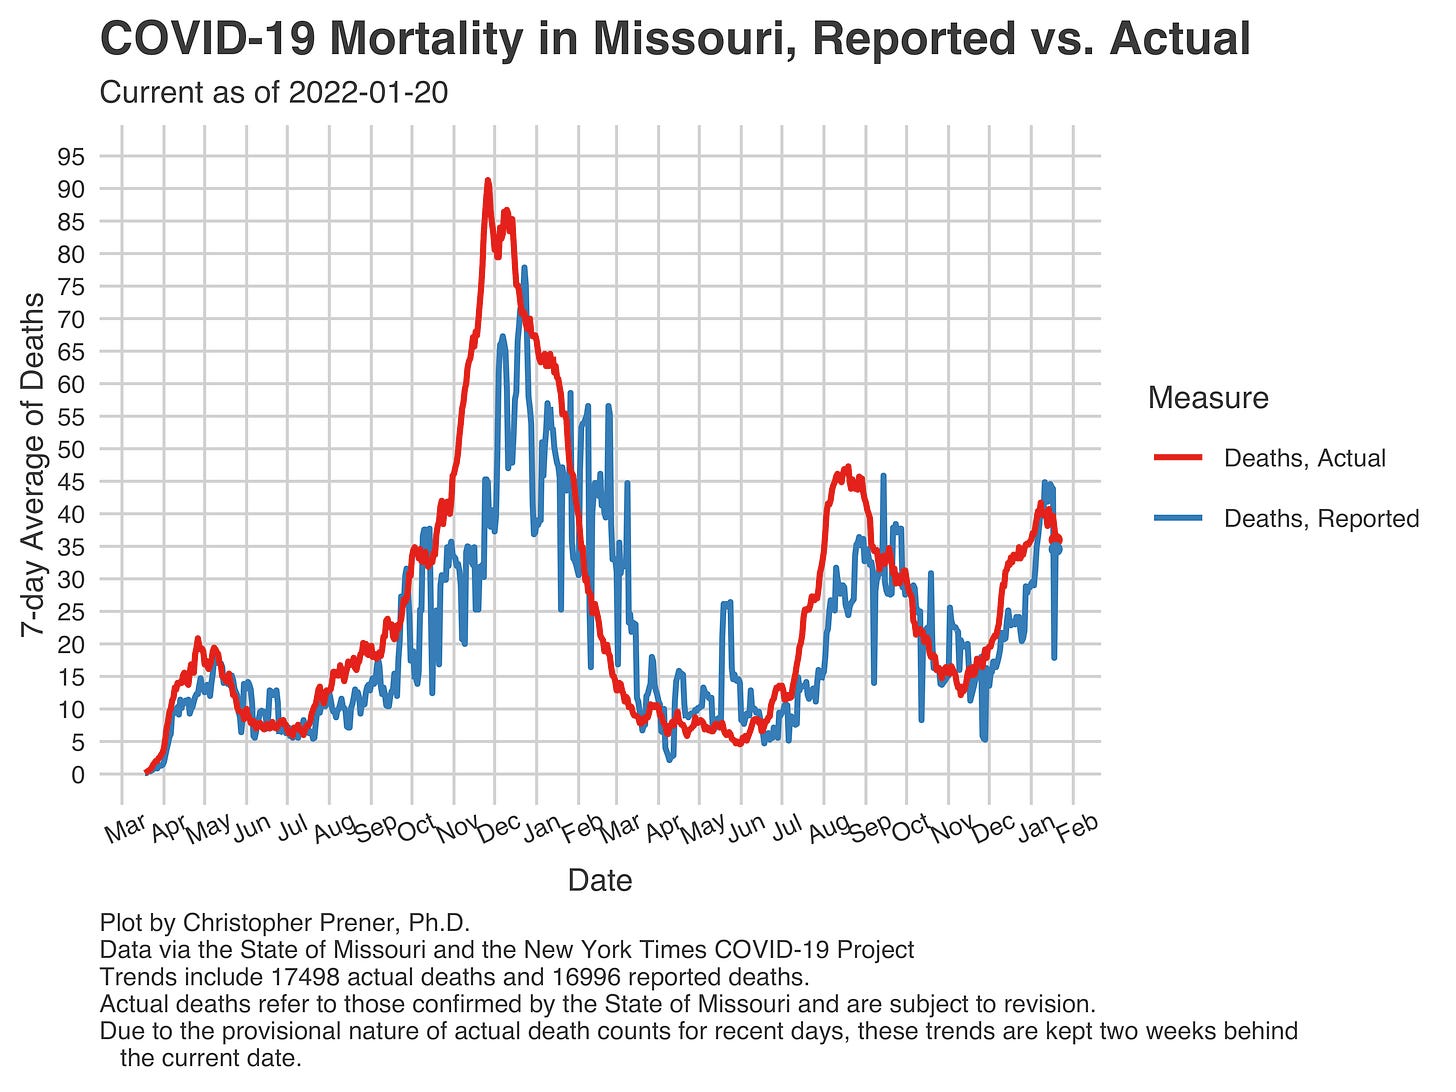
So again, things are good. They’re improving. However, we are still a long way from sustainable hospitalization numbers. We are also a long way from seeing significant excess mortality. The actual rate of deaths in mid-January is almost certainly too low, still, given how slow death certificate reporting is in Missouri. That said, we were near three dozen per day across the state.
In St. Louis’s hospitals, there were nearly twenty deaths per day around the same time. Given that St. Louis saw rates nearly twice that of the Delta surge, I would not be surprised if we ultimately find that a larger number of Missourians died during the Omicron wave than any other point except the fall-winter ‘20-‘21 surge.
So, while Omicron is milder and the proportion of fatalities is undoubtedly lower than other points, we are still losing many of our neighbors each day. Beyond hospitalization, this loss of life is another stark reminder of how far from normal we are right now.


