Tonight’s newsletter is a shorter one with no interview. I do have my usual top-line, illness, and vaccination data updates. I am hoping to be back with an interview next week. In the meantime, have a wonderful weekend! - Chris
COVID-19 by the Numbers
Total cases in MO: 585,211 (+4,806 from last Thursday)
7-day average of new cases per day in MO: 686.57 (+109.14 from last Thursday)
Counties with the highest per capita rates (per 1,000) of new cases per day this past week:
Not reported this week; see below for a discussion
Total deaths in MO: 8,977 (+85 from last Thursday)
7-day average of new deaths per day in MO: 12.14 (-0.14 from last Thursday)
Percent of people initiating vaccination: 26% (+3% from last Thursday)
Percent of people completing vaccination: 16% (+3% from last Thursday)
Case and mortality numbers are current as of Wednesday, March 31st. Vaccination numbers are current as of Thursday, April 1st. Additional statistics, maps, and plots are available on my COVID-19 tracking site.
Illness Trends in the Past Week
The big story in illness trends this week in Missouri is what isn’t happening. This past weekend, the State of Missouri reported many new cases over a three-day period in a cluster of counties in Northeastern Missouri. The spikes, which you can see below, brought Lewis, Marion, and Shelby counties well above their prior highs.
These increases also occurred in several other counties. They are all, however, artifacts from delayed reporting of tests. These tests were conducted over the last few months (some dating back to November 2020) in and around Quincy, Illinois. The Illinois Department of Public Health (IDPH) apparently did not communicate these to Missouri until now. When they did report these new cases, they were posted to Missouri’s dashboard over a several-day period from March 24th through March 26th.
The initial signal that something was not right came from several different maps, which shifted on the 25th and the 26th to highlighting only this cluster of counties I noted above:
What different about this so-called “data dump” was that it was regionally specific. Past data issues have affected the state as a whole (due to dashboard issues, for example) or a wide swath of states (due to antigen reporting tests, for example).
This region just so happens to be the region where the highest concentrations of the UK variant, B117, were reported in wastewater in late February. This naturally led to both concern and speculation that we saw a dramatic increase in new cases driven by a more contagious variant. In this context, it is a big relief that most counties’ increases (with a couple of exceptions) were just artifact is a big relief.
From a data perspective, however, this represents another significant letdown. Timely, accurate reporting of testing results, especially across state lines, meant here that we were missing hundreds of cases reported during the worst period of the pandemic. Moreover, DHSS did not move quickly to communicate these issues to the public. News media coverage did not highlight that this was not a real spike in cases for days after it appeared on maps.
All of this was complicated because there were actual increases in cases in several counties. These include both Knox and Shelby counties, both of which saw actual increases before and during the period when IDPH communicated all of these additional cases to Missouri.
Beyond these cases, I highlighted several counties that were experiencing increases in my Twitter thread on Tuesday. Rates in both Atchison and McDonald counties have both declined. Rates in Crawford County, outside of Cape Girardeau, have continued to climb, however.
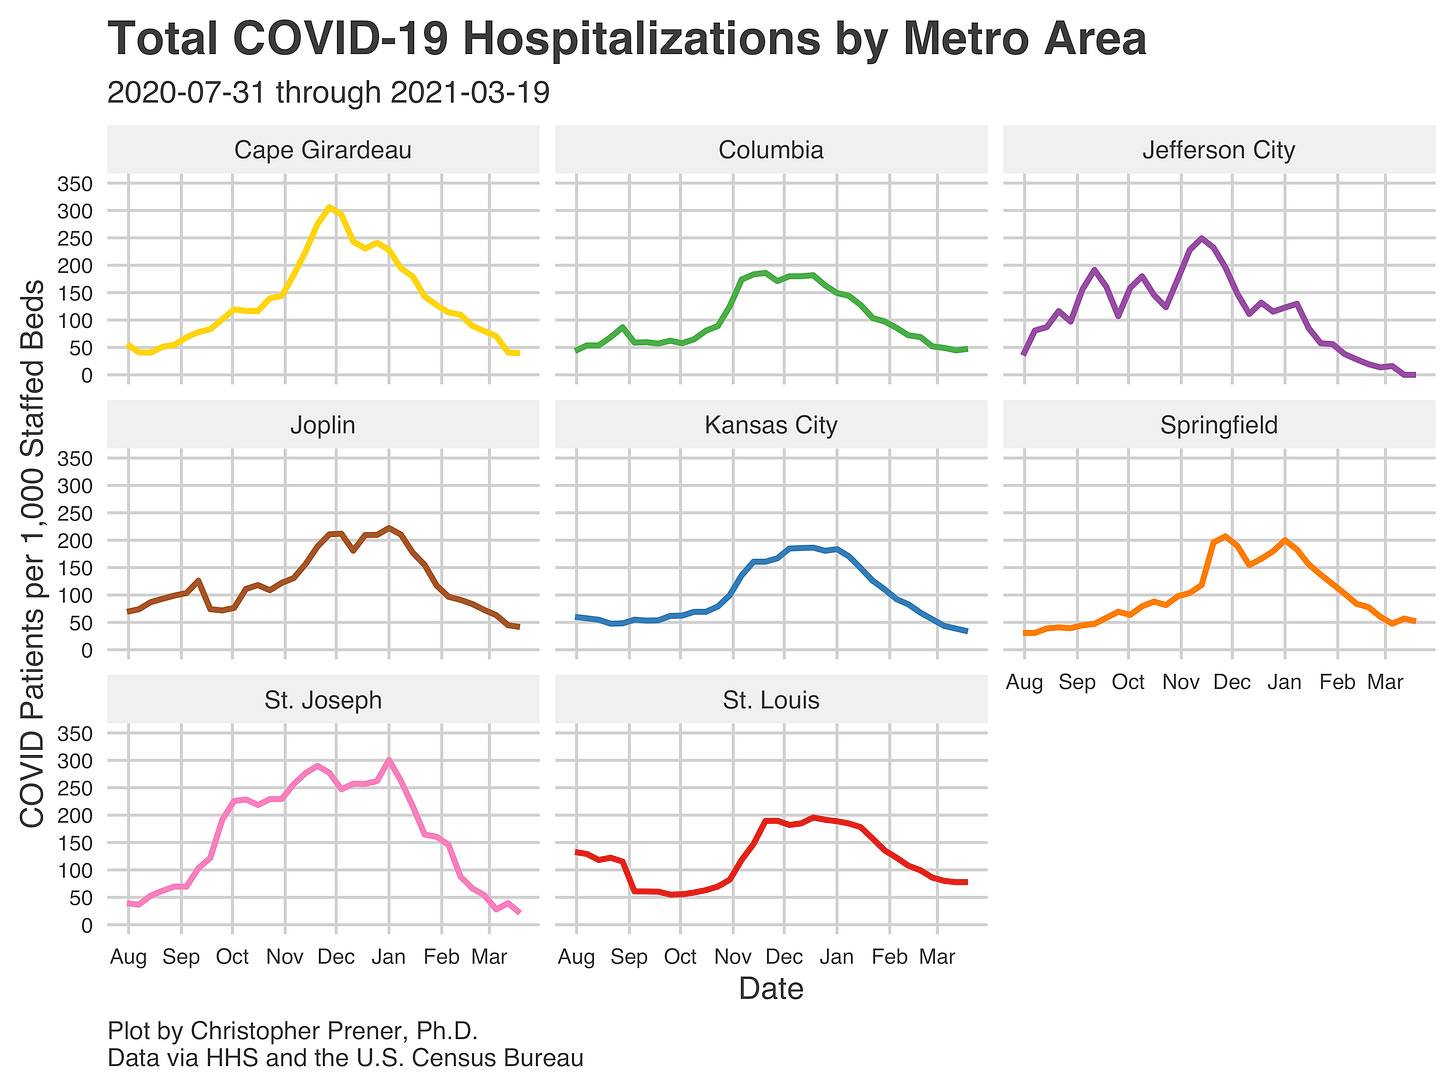
These short bursts of new cases are happening exclusively outside of metropolitan areas in Missouri. We have seen barely any movement upward at the metro level in terms of the pace of new cases. The St. Louis metro is perhaps the only place where rates have slowly been climbing upward but remain quite low compared to where they had been for much of the fall and winter.
Low case rates have meant decreasing pressure on the health care system. At the metropolitan level, the adult hospitalization rate in the Jefferson City region dropped to zero for two straight weeks. It is worth pointing out, however, that hospitalizations in nearby Columbia have not followed that trend.
Vaccination Trends in the Past Week
Two sets of trends that I highlighted last week remain. Districts A and C, which include Kansas City and St. Louis, respectively, are now among the top MSHP Districts for vaccine initiation. They join District F, which includes Mid-Missouri, which has the highest rate of people initiating vaccines. On the flip side, Districts I and G, which run from I-44 between Lebanon and Rolla south to the Arkansas border, continue to have the lowest vaccination rates.
Despite Region C moving towards having one of the highest rates of vaccination initiation in Missouri, St. Louis City notably lags behind the suburban counties to the west of the city. Rural corners of the metro, including Lincoln, Warren, and Jefferson counties, have similarly low vaccination rates.
If you like what you see here and don’t already, please subscribe!


