Tonight’s newsletter features an update on the latest case and vaccination data for Missouri as well as an “Into the Weeds” discussion of new research on COVID-19 in St. Louis that I presented for the first time earlier today. - Chris
COVID-19 by the Numbers
Total cases in MO: 593,882 (+4,518 from last Thursday)
7-day average of new cases per day in MO: 645.43 (+52.14 from last Thursday)
Counties with the highest per capita rates (per 1,000) of new cases per day this past week:
Holt (35.27 per 100,000), Jefferson (22.26), Crawford (20), Lincoln (19.54),
St. Louis (17.51), Dent (17.51), St. Louis City (16.29), and Warren (16.01)
Total deaths in MO: 9,101 (+100 from last Thursday)
7-day average of new deaths per day in MO: 14.29 (+10.86 from last Thursday)
Percent of people initiating vaccination: 33% (+4% from last Thursday)
Percent of people completing vaccination: 22% (+3% from last Thursday)
Case and mortality numbers are current as of Wednesday, April 14th. Vaccination numbers are current as of Thursday, April 15th. Additional statistics, maps, and plots are available on my COVID-19 tracking site.
Illness Trends in the Past Week
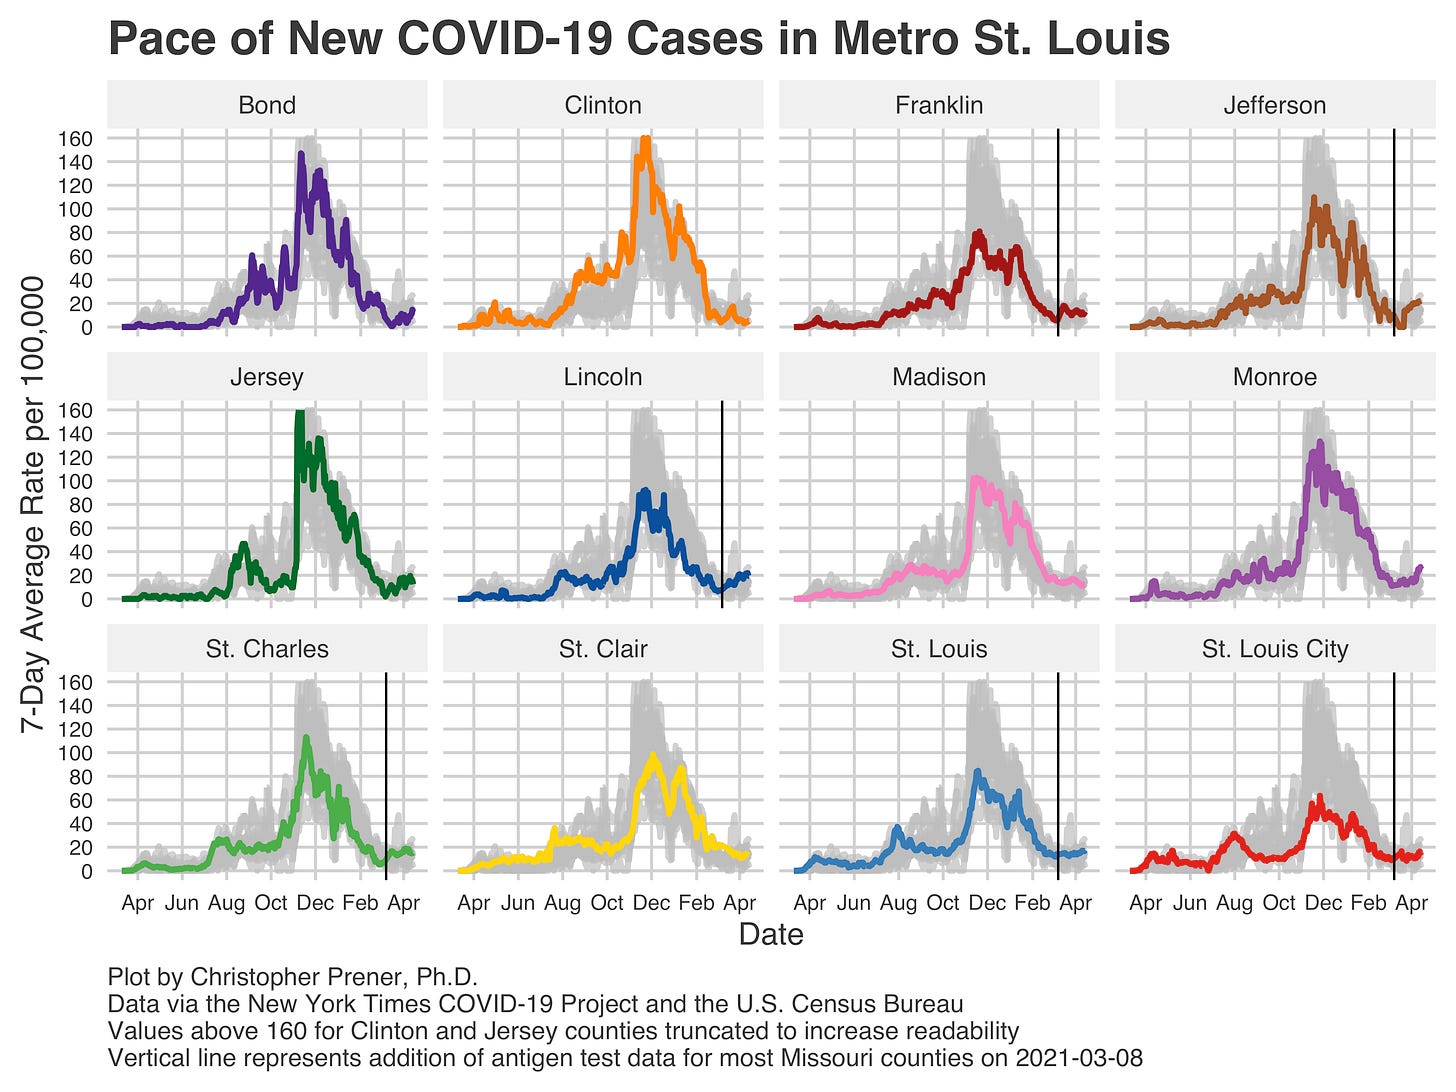
The most striking shift in the last week is what you can see above on the list of counties with the highest per capita rates of COVID-19 infections. Five of the eight counties are in the St. Louis metropolitan area. The only metro St. Louis counties absent from the list above are Franklin and St. Charles counties. This area stands out on our statewide map of new cases over the past week.
The most important piece to understand about the trends we are seeing is that this does not represent a dramatic increase in new cases in the St. Louis area. Rather, it represents a slow build in these 7-day averages over the past several weeks. Rates in St. Louis City and County, in particular, show this slow increase, as does the trend in Lincoln County. Jefferson County’s rate, on the other hand, has experienced a sharper increase.
I’m also concerned about the newly growing rates of new cases in Monroe County. Illinois is experiencing a sharp, steady increase in the volume of new cases. So far, this increase has not occurred to the same extent in Metro East. However, I’m watching for changes like what we are seeing in Monroe County right now.
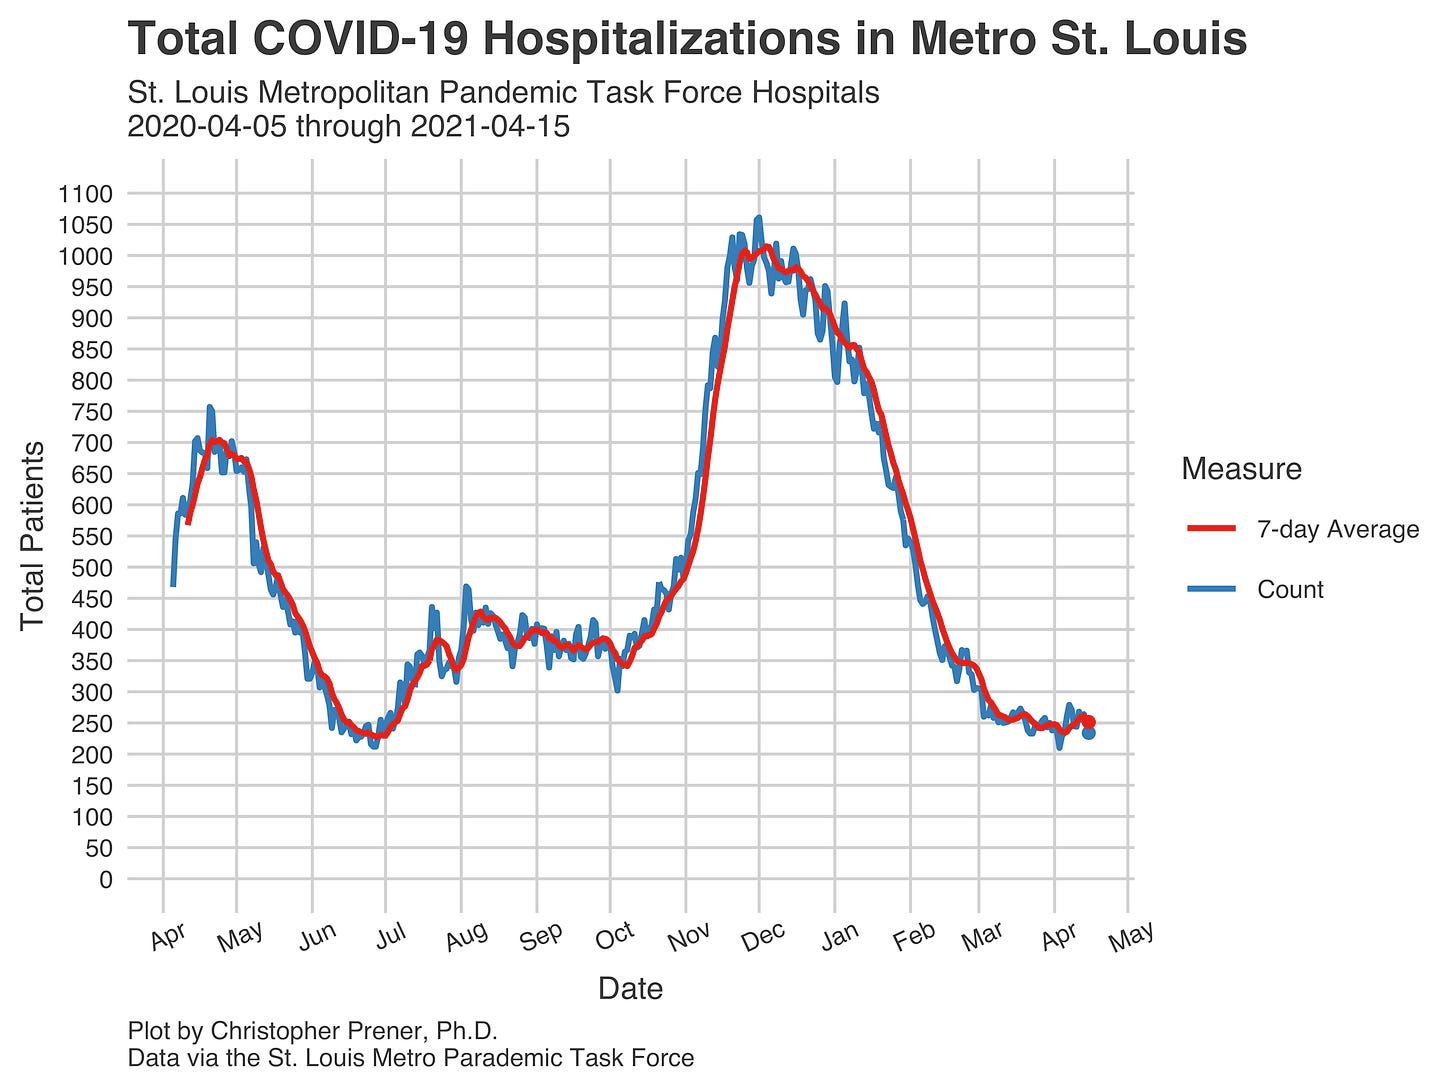
I am also watching hospitalization rates in the St. Louis area closely. Over the last week, the 7-day average of total in-patients had begun creeping up, but that increase has stopped for now. This is a good sign that, despite increasing case rates, we do not see significant signs of new pressure on hospitals.
Outside of metropolitan St. Louis, I’m also worried about three other areas. These regions are (1) around Mark Twain National Forest (especially Crawford and Dent counties), (2) in Northeast Missouri around Marion County, and (3) in Northwest Missouri. Holt County currently has the highest rates of new cases in Missouri right now in that third group.
Holt County is the latest in a pattern we’ve seen for the last month or so. Unlike the increases around St. Louis right now, which are pretty slow in nature, we’ve had a spate of rural counties that experience sharp but brief increases. We’ll check in next week with Holt County and see if this is indeed the trend that it follows as well.
Vaccination Trends in the Past Week
Our vaccination patterns, at long last, are finally showing growth in St. Louis City. There are several large clusters of counties where, like St. Louis City, vaccination rates are relatively high. The largest cluster stretches from Boone County east into the Missouri side of the St. Louis metropolitan area and then south along the Mississippi River to Cape Girardeau.
Aside from this large cluster, there are two other clusters worth noting. The first is around the Kansas City metro, and the second is around the Springfield metro. Beyond these high rates of vaccinations, Joplin in Southwest Missouri and Nodaway County in the Northwest.
These patterns are also reflected in the MSHP Districts used for distributing many of our vaccines. The four districts that are seeing the highest rates of vaccinations are those that encompass the three clusters I described above - C (St. Louis), A (Kansas City), F (Mid-Missouri), and D (Southwest Missouri).
I also remain concerned that Districts I and G, which cover the Ozark Mountains, are still lagging behind other regions in Missouri. This is true both in terms of the most recent vaccination rates and rates of completed vaccinations.
Something to note that Kansas City and St. Louis now lag behind only Mid-Missouri (District F) in terms of completed vaccinations.
In the Weeds
I spoke virtually at Delaware State University University’s Department of Sociology and Criminal Justice about race, poverty, and COVID-19 patterns in St. Louis. If this sounds interesting, you can check out my slide deck here. The most striking finding that I reported, and am continuing to dig into, is that there are period effects in terms of how COVID-19 unfolded in St. Louis.
For example, during the first three and half months of the pandemic (the “spring surge”), ZIP codes with higher poverty rates had higher rates of COVID-19 infections. During the “summer lull,” the relationship was far weaker. Then, during the "fall surge,” ZIP codes with lower poverty rates had the highest COVID-19 rates.
This does not mean those vulnerable residents who lived in more affluent areas during the “spring surge” were necessarily protected. However, it does mean that we have not experienced static patterns in COVID-19 risk over time by “neighborhoods” (I use the term very loosely here). Rather than the poorest and, as the slide deck shows, most racially segregated neighborhoods experiencing consistently higher rates, these patterns only are borne out during the “spring surge.” I’ll continue to keep folks updated as this research progresses.
If you like what you see here and don’t already, please subscribe!


