What a May it has been! We’ve had increased access to vaccines, lower case and hospitalization counts, new guidance on mask-wearing for vaccinated folks, and - unlike last year - my students get to graduate in-person next week. I’m thrilled for Saint Louis University’s seniors, who are flying towards the finish line despite three straight semesters of disruption.
For professors, the end of the spring semester is often a time to take a big deep breath. After fifteen months of pandemic teaching, that breath is pretty enormous. For those of you wondering why interviews have been a bit more infrequent and why I am so late with my newsletter this week, it is due almost wholly to the exhaustion I have accumulated from pandemic work and academic work since March 2020.
To slow things down a bit, I am going to hit the pause button on interviews for the summer. I will continue to send out weekly updates (like tonight’s) with perhaps a week or two off. When we get to late July, I’ll revisit things with the newsletter and contemplate the return of my interviews. I am hoping to return to Thursdays next week, too. I appreciate folks’ understanding! - Chris
COVID-19 by the Numbers
Total cases in MO: 608,341 (+2,935 from last Saturday)
7-day average of new cases per day in MO: 419.29 (-223 from last Saturday)
Counties with the highest per capita rates (per 1,000) of new cases per day this past week and the only counties with per capita rates over 15:
Shelby (68.35 per 100,000), Putnam (41.54), Cedar (21.52), Livingston (19.9), and Madison (18.73)
Total deaths in MO: 9,388 (+59 from last Saturday)
7-day average of new deaths per day in MO: 8.43 (-3.86 from last Thursday)
Percent of people initiating vaccination: 40% (+1% from last Thursday)
Percent of people completing vaccination: 33% (+3% from last Thursday)
Case and mortality numbers are current as of Friday, May 14th. Vaccination numbers are current as of Saturday, May 15th. Additional statistics, maps, and plots are available on my COVID-19 tracking site.
Illness Trends in the Past Week
In terms of new cases, Missouri is at its best point since (at least) the beginning of July. Comparisons with numbers before September are tricky. The testing environment was quite different back in the early days of the pandemic. Our early numbers, especially from March through the end of July, are biased downward in really significant ways. Rates were likely higher in July than they were now. This makes the declines to our current numbers all the more notable.
The changes we see right now are really coming from the St. Louis area. I picked the outstate plot above specifically because we have not really seen a decline in new cases in this wide swath of Missouri, even as statewide cases have come down significantly. Shelby County’s per capita rate of new cases stands out for being the highest in Missouri right now.
However, if you look at the raw numbers of new cases, Shelby is actually pretty typical. Rural counties see pretty uniform numbers of new cases right now - really anywhere from less than one new case per day on average to about seven and a half. Then counties in Missouri have not had a new case in over a week now.
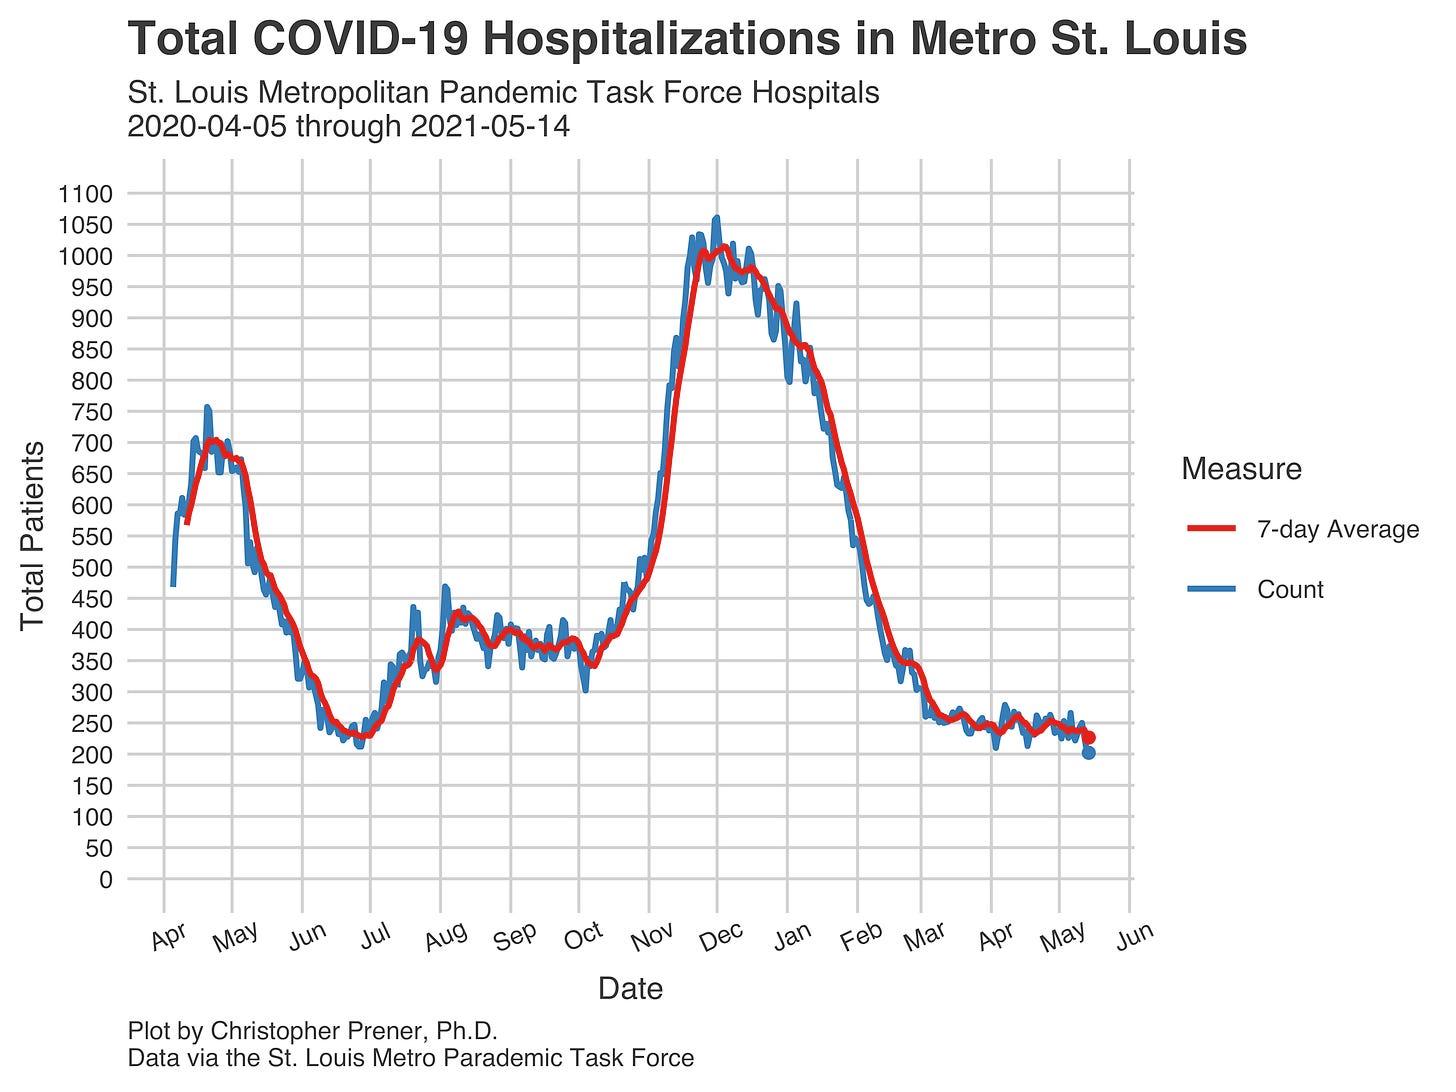
Since, as I said above, testing has varied so greatly over the course of the pandemic, I like to look at our trends since last March in the context of hospitalizations. Unlike most of Missouri, where we only have data back to July from HHS, the St. Louis Pandemic Task Force data covers almost all of the pandemic. My preference for these data comes from the fact that, unlike with testing data, we have a much better sense of what the first wave of COVID-19 cases in the St. Louis area looked like.
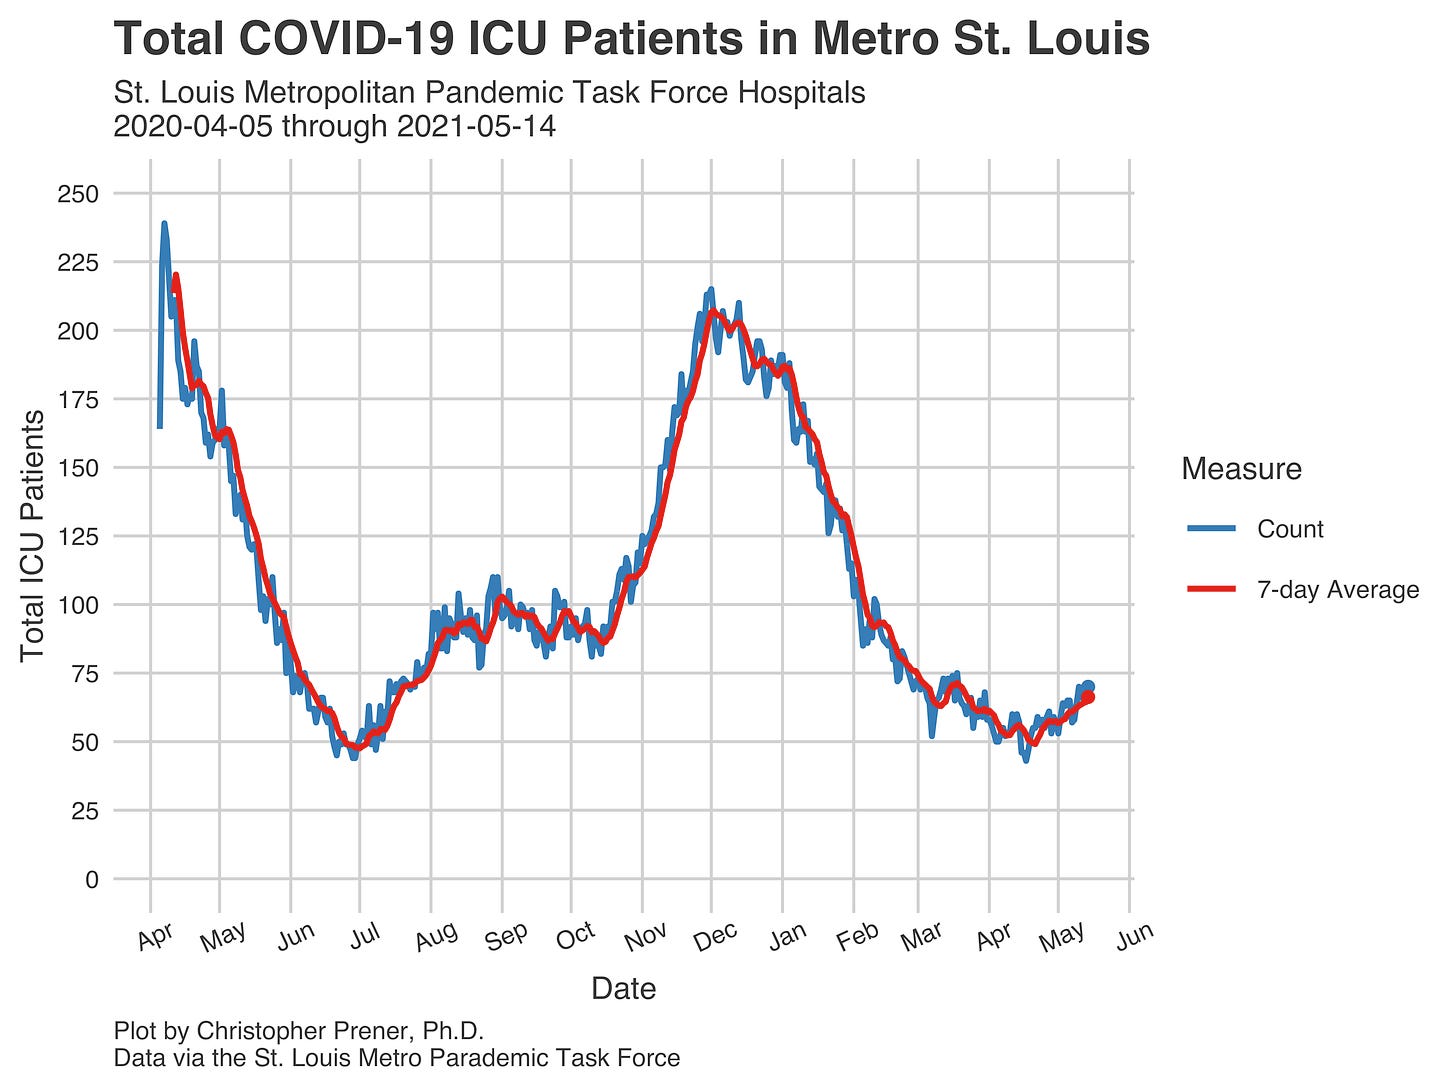
The low case rates statewide and the large decreases in the St. Louis area in the last week or two are reflected here. In addition, our total number of in-patients yesterday was at its lowest one-day value since data tracking began. The seven-day average was also at its lowest value. These are excellent trends that have one asterisk next to them: despite declining numbers of cases, new patients presented at hospitals, and total in-patients, the share of very sick patients requiring ICU care is growing.
To be clear, the increase is nothing like the magnitude of ICU patients we saw in St. Louis during the first two major surges of the pandemic and is below the summer-lull levels of patients as well. I would be remiss if I did not point this trend out, however.
Vaccination Trends in the Past Week
This overall slowdown in new cases is the second most important trend right now. The first is our vaccination progress. Our number of Missourians initiating vaccination grew just one percentage point over the past ten days, from 39% to 40%.
On the plus side, the number of our neighbors who have completed their vaccinations has continued to grow. High vaccination activity continues to be focused in three major areas: Kansas City, Columbia, and St. Louis.
After several disruptions to my vaccination data workflow, I am excited to have some new data to share with folks this week on both racial disparities in vaccinations and a more accurate representation of the share of Missourians who have been vaccinated. Stay tuned on Twitter this week, and I will share highlights this coming Thursday when I send out the next River City Data!
If you like what you see here and don’t already, please subscribe!


