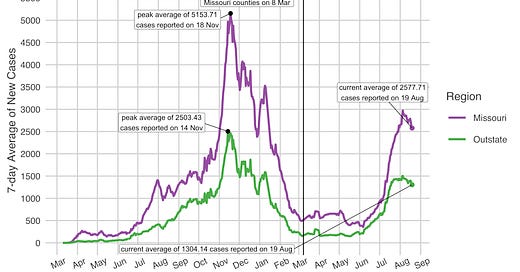
Hard to believe that we have now been talking about Missouri’s wave of new cases fueled by the Delta variant for nearly three months. I looked back, and my first newsletter that flagged rising rates of new cases was at the tail end of May. We now know that Delta had been spreading for at least a few weeks before that in Missouri. The good news is that more than three months after Delta was detected in wastewater, we are starting to see declines in the number of new cases.
The two big questions right now are what happens as K-12 districts and colleges resume classes, and, if that does not produce a significant spike, just how long it takes for our cases to fall back to their baseline. I don’t answer either question, but I do get into where cases are rising and falling in tonight’s newsletter. - Chris
COVID-19 by the Numbers
Total cases in MO: 747,448 (+18,044 from last Friday)
7-day average of new cases per day in MO: 2,577.71 (-166.57 from last Friday)
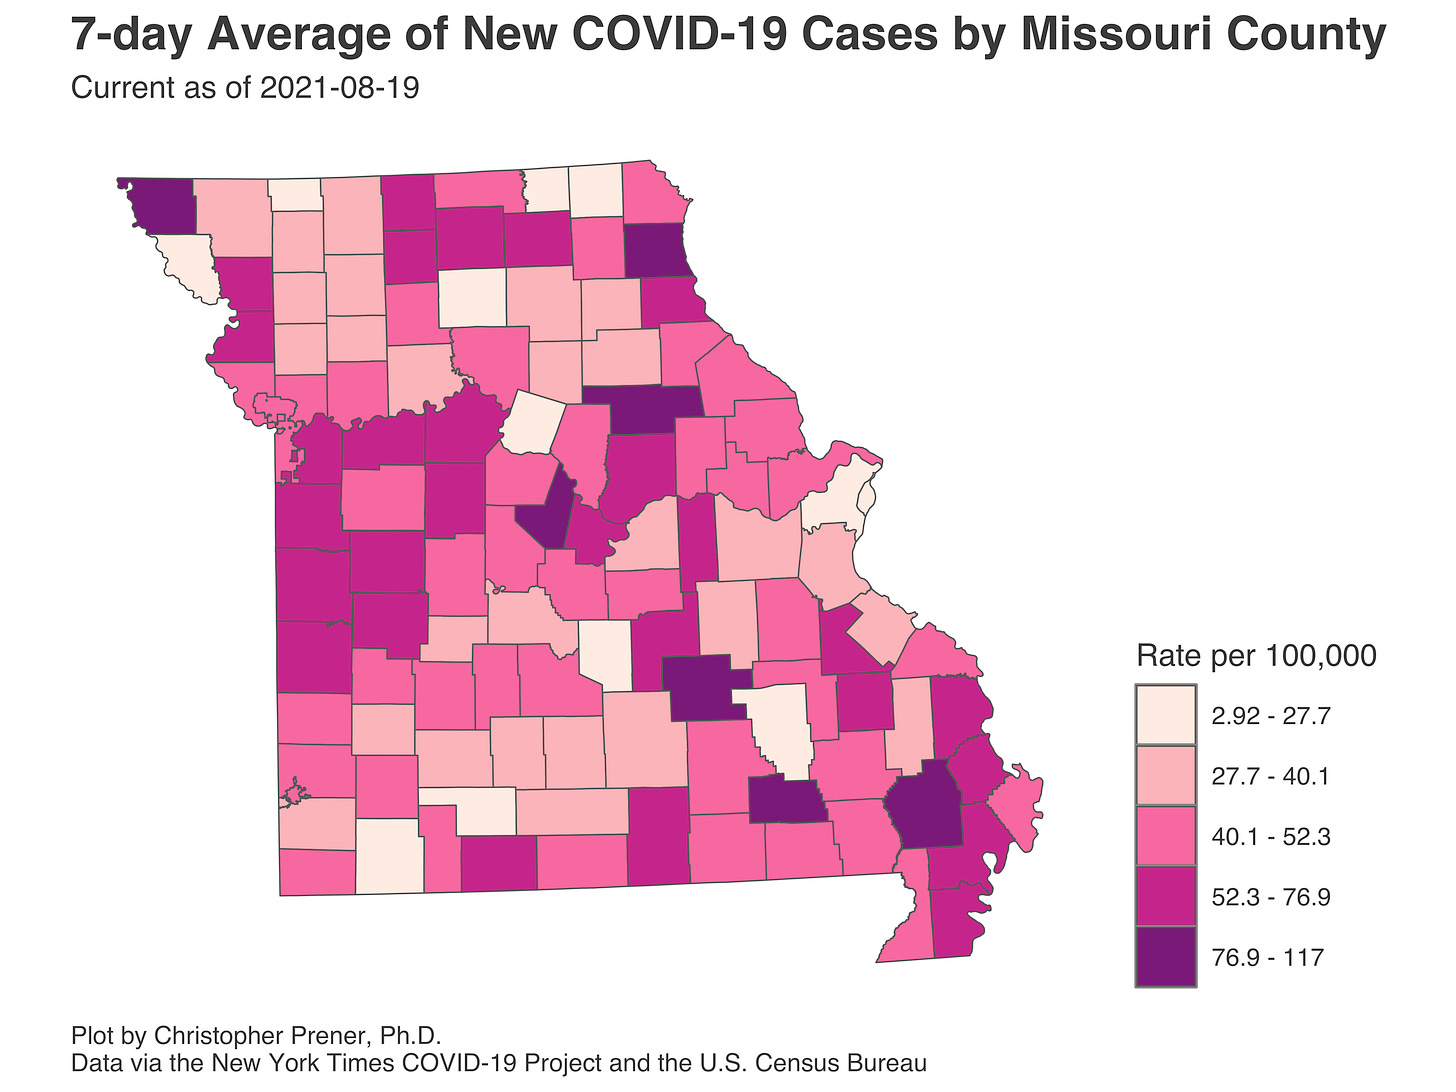
Counties with the highest per capita rates (per 100,000) of new cases per day this past week:
Audrain (116.57 per 100,000), Carter (103.74), Lewis (89.76), Dent (86.61), Stoddard (83.74), Moniteau (79.67), Atchison (78.61), Scott (75.25), New Madrid (73.79), and Marion (70.75)
Total deaths in MO: 10,832 (+171 from last Friday)
7-day average of new deaths per day in MO: 24.43 (-4.43 from last Friday)
Percent of all Missourians initiating vaccination: at least XX% 45% (+1% point from last Thursday)
Percent of all Missourians completing vaccination: at least XX% 38% (no change from last Thursday)
Case and mortality numbers are current as of Thursday, August 19th. Vaccination numbers are current as of Friday, August 20th. Additional statistics, maps, and plots are available on my COVID-19 tracking site.
Illness Trends in the Past Week
Over the last week, we have moved from “ebbing” cases (which is how I characterized them in my last newsletter) to falling cases. There are a small number of counties seeing substantial increases right now, which I’ll get to in a moment. However, at the state, regional, and metro levels, new cases are falling across the board. This is especially welcome in “outstate” Missouri, where very high rates of new cases have contributed to significant pressure on hospitals and set all-time high points in several counties.
Despite this general decline, outstate is also where we see some remaining spikes in new cases. Looking at the map below, you’ll get a sense of where some of those spikes are. The most significant areas are in Southeastern MO, in corners of the Ozarks (especially Carter County), and Mid-Missouri (especially Audrain County).
Other areas of the map that generally appear high, like Northern Missouri (including along the Mississippi River) and counties east and south of Kansas City, are seeing declines in their rates of new cases. Again, however, the drops are unfolding at a pretty slow pace.
Southeastern Missouri has the largest collection of gradually increasing rates of new cases. This makes sense, given that the Delta variant had largely passed the region over for the last few months except for Butler and Stoddard counties. The area has also had higher vaccination rates than other “outstate” locales, especially around Cape Girardeau.
There is a mix of trajectories in this part of Missouri, making it a bit of a microcosm of the state as a whole. Cape Girardeau had seen a significant spike but declined. Scott, Stoddard, and New Madrid counties are all showing sharp increases, and other counties like Bollinger and Butler have been pretty stable, especially over the last week. The drop in Cape Girardeau means that the overall metro rate has dropped slightly, even as nearby counties continue to see increases.
The Joplin and Springfield metros are seeing clear signs of falling case rates. We see less clear drops in Jefferson City and even smaller drops in Kansas City and St. Louis. The three metros where the jury is still out are Cape Girardeau, Columbia, and St. Joseph.
St. Louis presents an interesting departure from most other parts of Missouri. To this point, the Delta variant spike has been less severe here than in any other metro area. The core urban counties, St. Louis City and St. Louis County, have returned to masking to varying degrees - the City has a mandate in place, and the County’s has been subject to ongoing legal wrangling. Nevertheless, the mere act of putting a mandate in place in the County, and having a sustained mandate in the City, may have yielded significant dividends. Since the mandates originally went into effect, rates have been very stable and have even fallen slightly in the county.
All of this is speculative, of course. I cannot establish a firm causal connection between the timing of the mandates and the timing of the flatten rates. But over the same period, rates remained at higher levels in St. Charles County, for example, despite very high vaccination rates. Many other parts of the state saw increases, especially during the early part of the period covered by the plot above. On the flip side, Jefferson County has seen decreases, especially over the last ten days, even without a mask mandate. Again, I can’t say for sure that masks are why the City and the county have their particular trajectories, but they are certainly departures from regional and statewide patterns.
What I think is also interesting is the overall position of St. Louis City with cumulative case rates. The city and the county are almost certainly missing cases that we should have identified early in the pandemic but didn’t because of a lack of testing infrastructure. That said, the city in particular now has one of the lowest cumulative rates of new cases in the entire state.
Despite this, we are still seeing very high rates of hospitalizations, especially relative to where we found ourselves in St. Louis in April 2020. This feels discordant with our overall rate of new cases.
There are a couple of possibilities I can think of that explain these patterns. First, we may be missing cases in the community because the mix of symptoms might be changing. Second, some of these patients are from “outstate,” where rates are higher, or may be from further outside of the metro area. Third, others may be caught incidentally when they go into the hospital for an unrelated procedure. Finally, we know that the odds of hospitalization decrease with vaccination, and hospitalizations in St. Louis are largely among unvaccinated individuals. So, while the overall per capita rate of new cases is low, there may be enough unvaccinated folks in St. Louis to produce high numbers of hospitalizations. All of these are speculative, and the reality is that they all probably weigh on our hospitalization rates to some degree.
As of early August, we have evidence now that hospitalizations in four other Missouri metros (Jefferson City, Joplin, Springfield, and St. Joseph) were starting to plateau. This is great news, though there are not any signs of significant drops yet. At the same time, Cape Girardeau, Columbia, and Kansas City all have growing in-patient numbers. Cape Girardeau’s numbers are worth watching closely, given just how quickly they have climbed.
Finally, I want to draw attention to mortality numbers. Like hospitalizations, they’re lagged by a couple of weeks. What we see, however, is mortality numbers that are comparable to the deaths we saw in April 2020. I strongly suspect that these numbers are biased downward due to limited testing and the stubborn refusal of Missouri’s public health leaders to release the number of deaths where COVID was suspected but not confirmed.
Vaccination Trends in the Past Week
Regarding vaccinations, rates have not changed much over the last week despite the press over lottery drawings. I am not particularly surprised. A recent paper in the Journal of the American Medical Association (JAMA) found that Ohio’s lottery had no significant effect on vaccination rates. Incentives may work for some populations, but we have not seen robust evidence that they work as a general strategy for increasing COVID-19 vaccination uptake. We’re generally getting the highest rates of new vaccinations across Southwest, Southeast, and Mid-Missouri. The rates in Butler County and Stoddard County are notable, lagging recent spikes in new cases there.
Overall, we are seeing more counties near having half of their entire populations with completed vaccinations. Rates are highest in the St. Louis metro (but not in St. Louis City), Mid-Missouri, and the Kansas City area. This is unsurprising, as is the continued low rates of completion throughout the Ozarks and Bootheel.
If you like what you see here and don’t already, please subscribe!


