In May, I had a few weeks period where I felt good about where we were headed. Vaccinations were ticking along at a great place, and new cases had fallen too far lower levels than we had seen in at least a year (and perhaps ever). By early June, my tune had changed.
I had a short conversation today with a major business leader in St. Louis. Like a lot of folks, myself included (in May at least), they thought this fall was going to see us “getting back to normal.” However, they are now adjusting to the realization that we are in for another season of disruption.
I think our thinking needs to shift from just getting to next month to understanding that COVID-19 will not go away. For much of 2021, the discussion about the end game among public health professionals has been that there is not one. SARS-CoV-2, the virus that causes COVID-19, is likely going to become endemic. This means it will continue to circulate and infect people, though, like pandemic influenza strains, it may become less likely to cause severe illness over time.
It’s an open question about how we get there, though, or how long that evolution takes. In Missouri, our third wave of COVID-19 is causing significant numbers of cases, hospitalizations, and deaths. Moreover, it is showing no signs of ebbing, with nearly 20,000 new cases added in the last week. What we are experiencing right now, and what we will experience this fall, may not be the “new normal.” However, there is also not going to be a return to our pre-pandemic “normal” either. - Chris
COVID-19 by the Numbers
Total cases in MO: 706,153 (+19,976 from last Thursday)
7-day average of new cases per day in MO: 2,853.71 (+356.29 from last Thursday)
Counties with the highest per capita rates (per 100,000) of new cases per day this past week:
Sullivan (124.38 per 100,000), Howell (107.58), Ozark (97.44), Bates (93.35), Ralls (92.28), Marion (89.68), Reynolds (81.44), Henry (79.42), McDonald (76.35), and Lewis (75.51)
Total deaths in MO: 10,432 (+156 from last Thursday)
7-day average of new deaths per day in MO: 22.29 (+6.29 from last Thursday)
Percent of all Missourians initiating vaccination: at least 44% (+1% point from last Thursday)
Percent of all Missourians completing vaccination: at least 38% (+1% point from last Thursday)
Case and mortality numbers are current as of Wednesday, August 4th. Vaccination numbers are current as of Thursday, August 5th. Additional statistics, maps, and plots are available on my COVID-19 tracking site.
Illness Trends in the Past Week
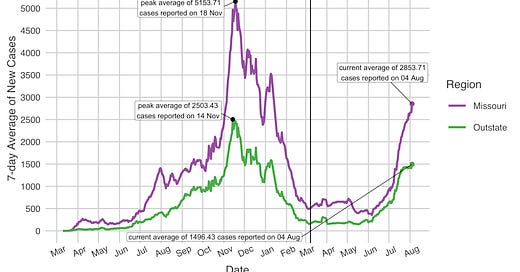
Media reports today highlighted the fact that we had reached an average of 3,000 new cases. My 7-day average for Missouri shows a slightly lower number (2,853.71, see the purple line below), owing to some differences in how my data are collected and reported. Honestly, the precise number does not matter because both are wrong. Due to folks not getting tested or even knowing they are infected, our case numbers are proxies of community spread and not a true census. Whatever the exact number is, we see rates of new cases accelerating in key areas of the state.
This acceleration is even true in parts of “outstate” Missouri, where we had seen a very noticeable plateau in the 7-day average over the past two weeks. You can see that flat green line over the second half of June in the plot above. At the same time, we see a steepening spike of cases in Kansas City, where rates jumped yesterday as part of the largest one-day number of reported cases since last January (about 4,400 new cases were reported).
I want to touch on both regions, as well as St. Louis, because the dynamics in each area of the state are different right now.
First, “outstate” Missouri. The concern here is persistently high rates of new cases that are falling slowly are falling slowly in the best case. The area around Springfield is a good example of this trend. Over the past few weeks, rates in all of the key counties have fallen. However, they have not fallen especially far in most cases. Greene, Christian, and Dallas counties’ patterns are more typical of what we see right now than the slightly larger drops in Taney and Stone counties.
These declines are being offset by increases elsewhere in outstate Missouri. One key area where those increases are occurring is around Cape Girardeau. This area had largely missed out over the first two months of our Delta wave in Missouri, but belatedly, it is starting to catch up.
We see a similar pattern around Hannibal, Missouri, where a cluster of high rate counties straddles both sides of the Mississippi River. In both cases, these increases (along with high rates around Jefferson City) are enough to offset the decreases we see elsewhere in outstate Missouri. Therefore, the plateau is a bit of an illusion - it obscures the slowly shifting case rates we have.
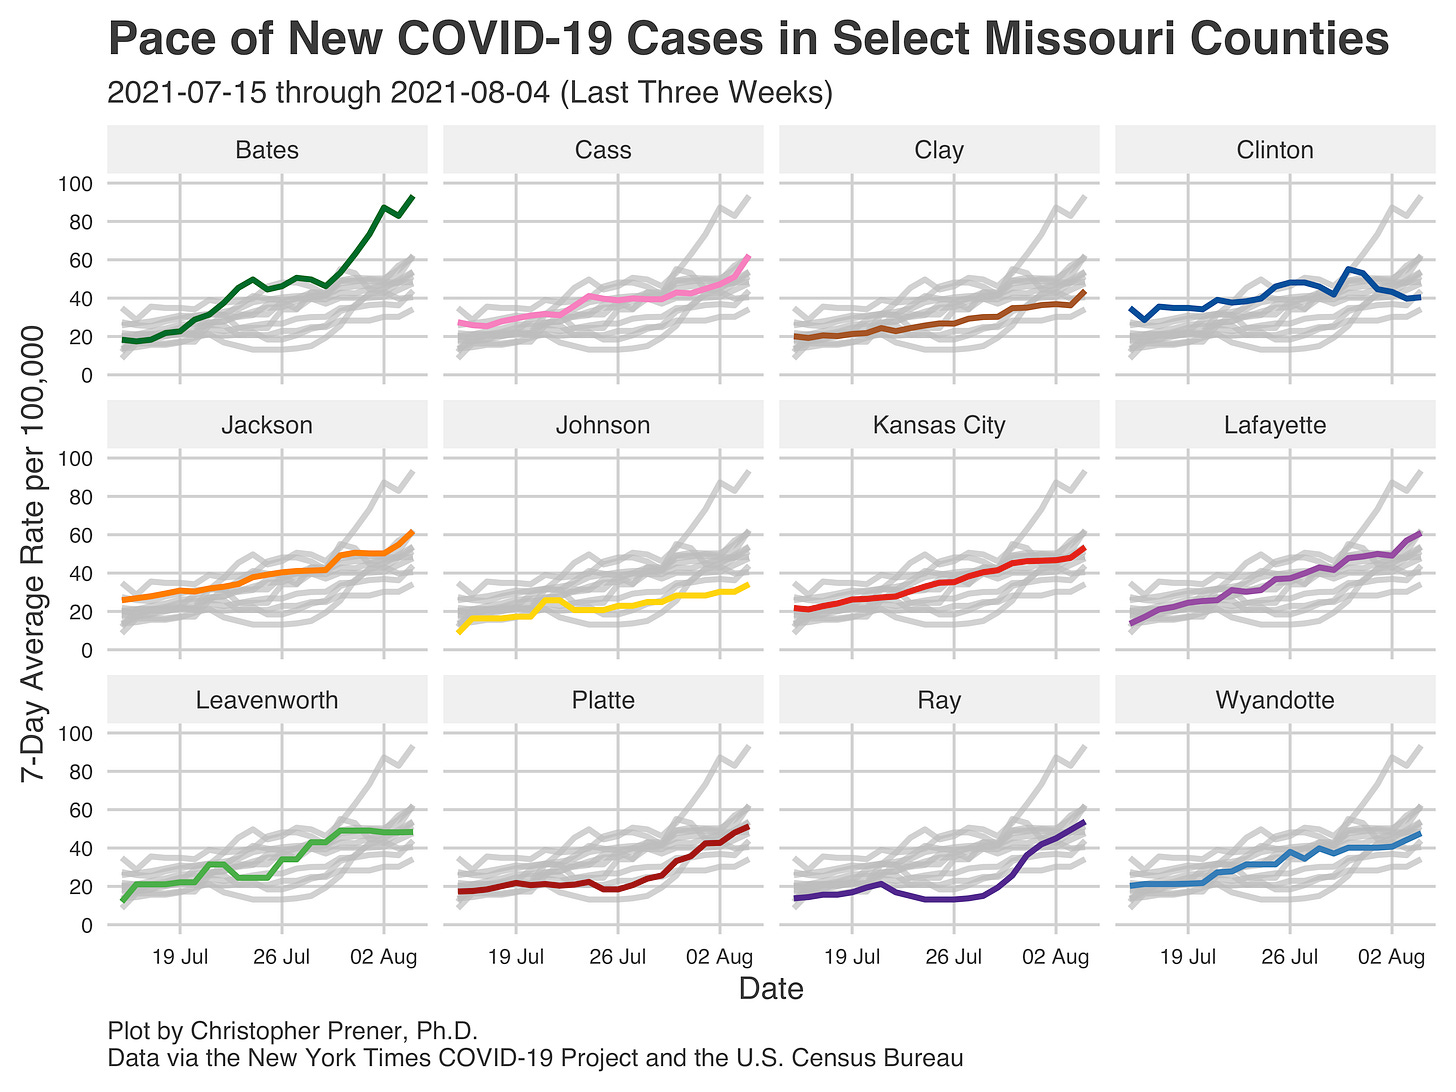
In Kansas City, as I said above, the story is different. Here it feels more similar to Springfield in June when case rates began to jump dramatically. Case rates are climbing pretty steadily across the region but are a bit higher on the Missouri side of the metro at the moment.
Bates County, which is a new addition to my KC metro plots, has the largest per capita bump at the moment. In fact (and with acknowledgments about how tricky it is to compare case rates across time because of testing changes), it has all-time high rates of new cases right now. Cass and Lafayette counties are nearing similar marks. Based on these trends and the experience of Springfield and Joplin over the last two months, I think it is possible that the Kansas City metro as a whole comes near to an all-time high rate of new cases in the next couple of weeks. It may even surpass that mark.
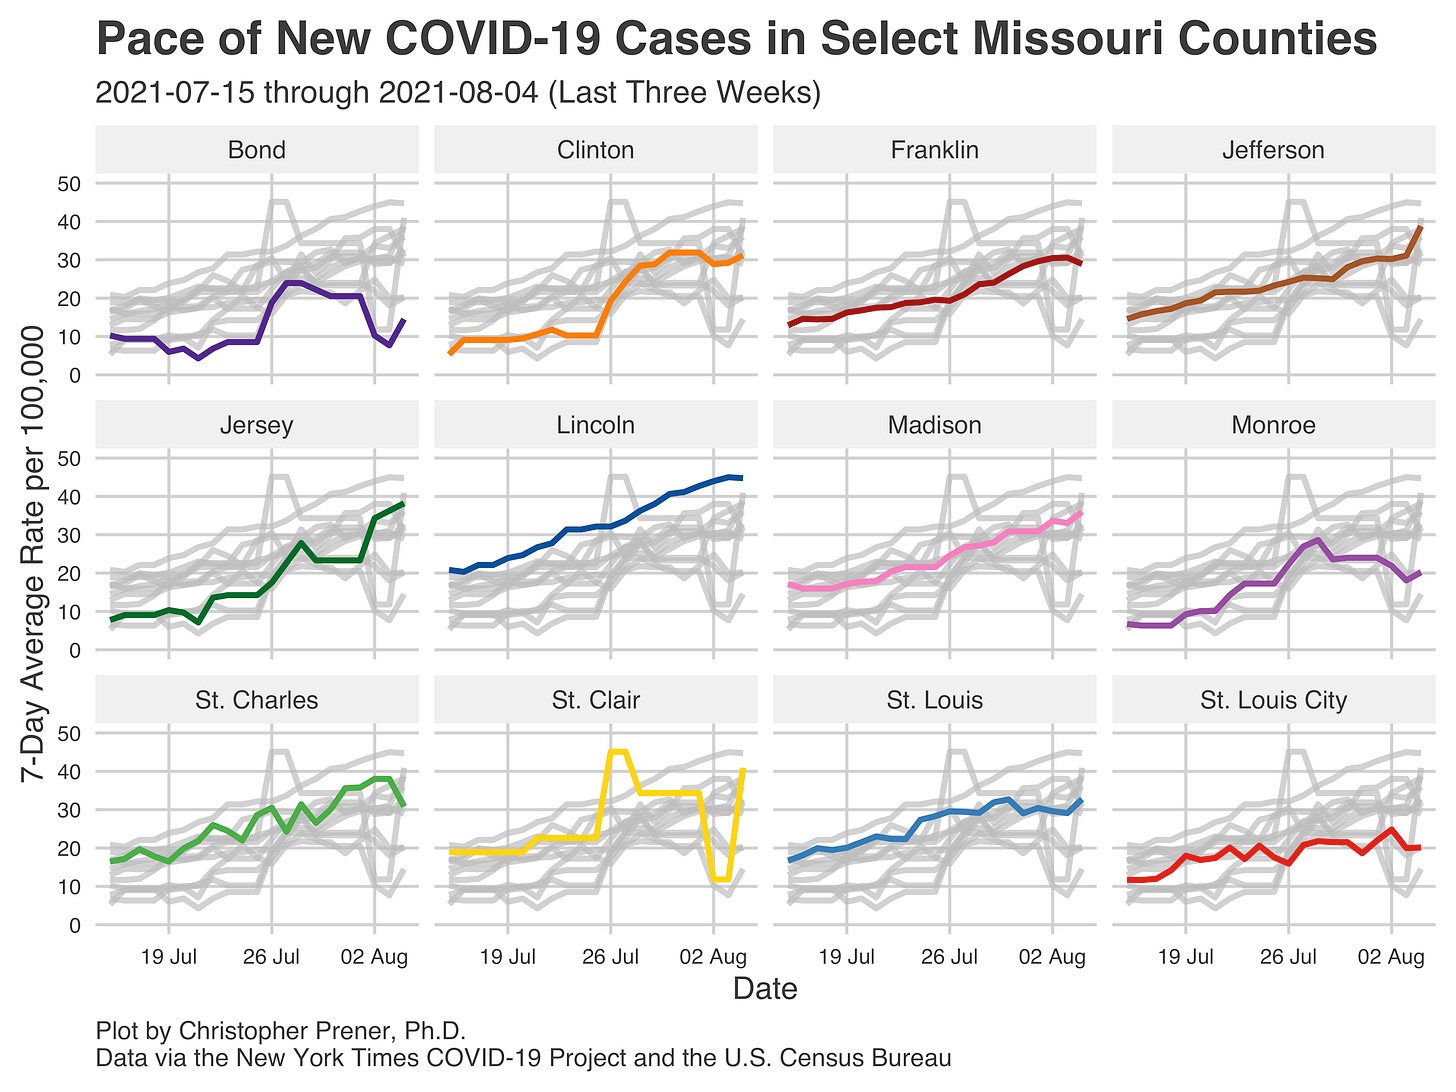
In St. Louis, we have yet a third pattern. So far, case rates are rising at a slower pace than they have elsewhere in Missouri. Moreover, rates in the two central counties in the metro - St. Louis City and County - have plateaued. By this time next week, we will have fully baked in the effect of the mask mandates. One open question is whether the readoption of masking is happening at high enough rates to make a difference even though the County’s was paused by a judge’s temporary restraining order.
Despite the plateaued rates, we see exurban and rural parts of the St. Louis metro that are seeing spikes. Jefferson, Jersey, and Lincoln counties are notable examples of these increases. I suspect this is driving our hospitalization rates here in St. Louis, which are rapidly climbing. I have said before that I believe hospitalizations give us the best snapshot of the trajectory of COVID in St. Louis, and you can see the clear emergence of a third wave here despite the overall lower case rates. This makes me very apprehensive about what the next two months hold for us.
We can get a sense of what is coming in hospitalizations from other parts of the state. Through the later part of July, federal data shows hospitalization numbers that surpassed their winter highs in three Missouri metros - Jefferson City, Joplin, and Springfield. This is a critical data point for assessing how we are doing outstate and understanding what may be coming to Kansas City and St. Louis.
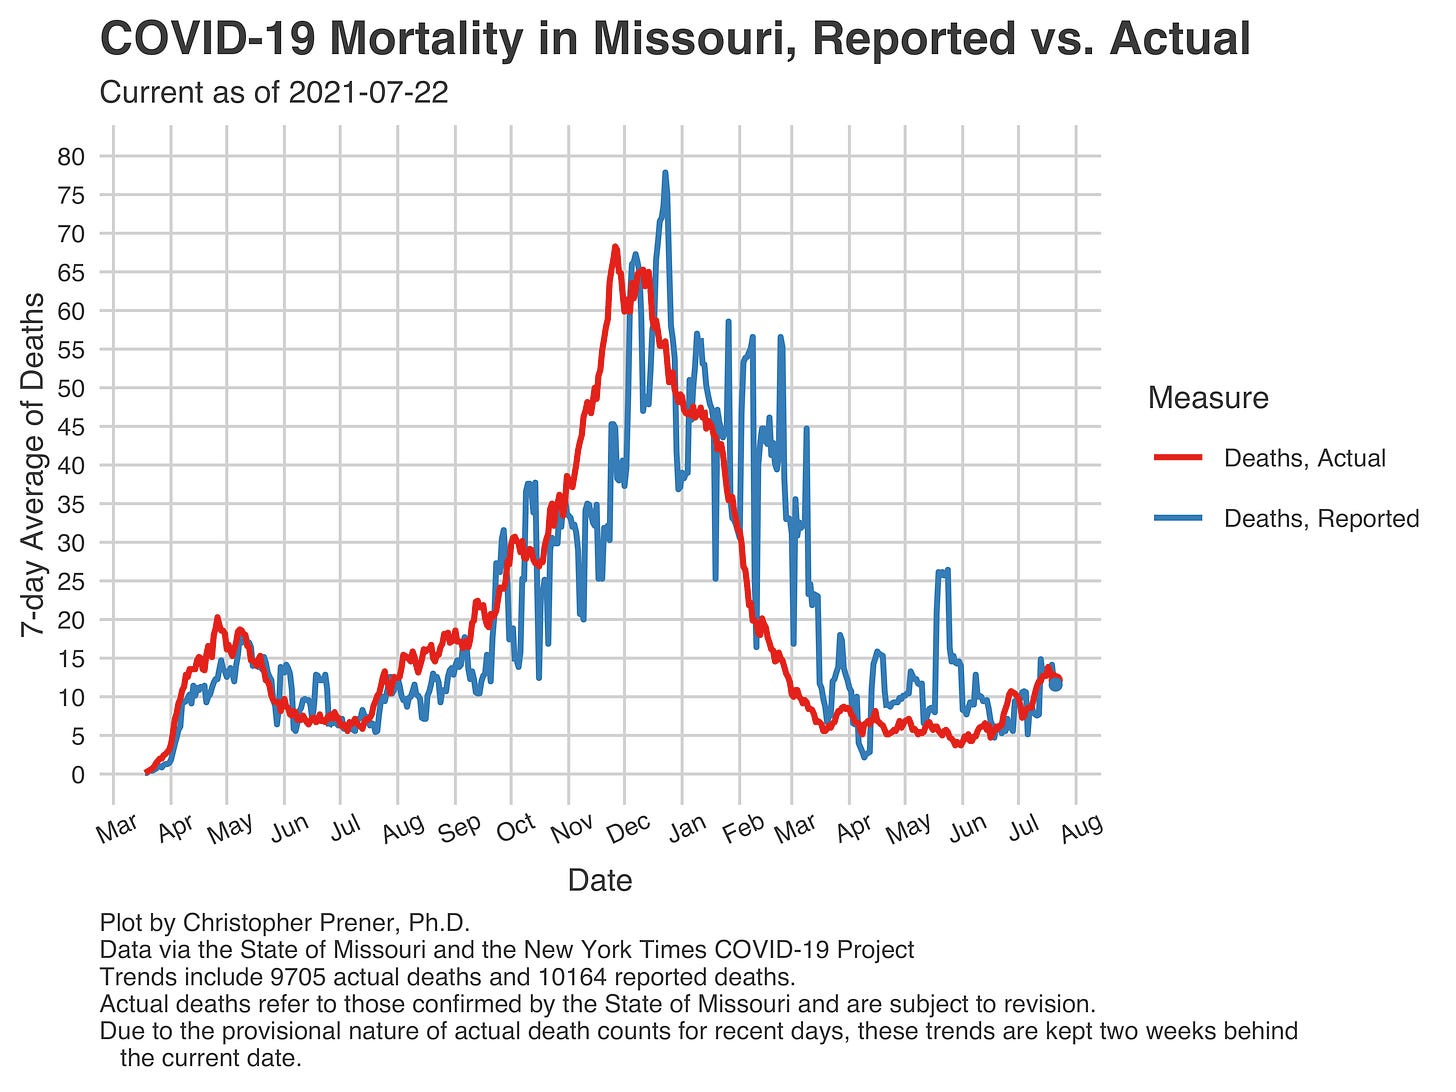
The same is true in our mortality data. We are now seeing rising numbers of deaths beginning in mid-June. These data are still trickling in, and given the number of new deaths reported this week (well over 100), I anticipate that it will continue to climb as our data improve through reporting over the next month.
Right now, most of the new deaths we have reported are coming from Springfield and Joplin metros (notice the spikes in the brown and orange lines below). However, that will shift as well as case rates and hospitalizations rise in other parts of the state.
One possibility I am entertaining is that the third wave produces high numbers of cases, hospitalizations, and deaths. In some places, we may even surpass our peaks from the winter wave. However, based on the UK’s rapid deceleration, we may find that while the peak is higher, the overall number of cases, hospitalizations, and deaths we experience with this wave is cumulatively smaller. Only time will tell, and I think we are still weeks away from talking about rising cases in parts of Missouri, including Cape Girardeau, Kansas City, and St. Louis. I also think we may see renewed jumps in counties with college towns where state schools lack vaccination requirements.
Vaccination Trends in the Past Week
Vaccinations are picking up across Missouri. Notice how they are spiking in many places where cases have either peaked (Southwest MO, Lake of the Ozarks, Mid-MO, part of Northern MO) or are rising rapidly (Kansas City). The problem is that these rates are nowhere near large enough to make up the gap that exists right now in a low vaccination state like Missouri. We need these increases to be even larger and more sustained than they have been so far.
The best news is that over half the population in three counties - Boone, St. Charles, and St. Louis counties - have now initiated vaccination. The City of Joplin has an even higher rate than these three counties - 56% of all residents have initiated vaccination.
These high points are worth celebrating but look at the rates in the Ozarks, Bootheel, and along the Iowa border. They are incredibly low. In some cases, less than 20% of the population has started the vaccination process despite the renewed spikes in cases. St. Louis City (42%) has a similar rate to Greene County (44%). Keep that in mind as you assess the likelihood of a spike in cases in St. Louis.
If you like what you see here and don’t already, please subscribe!


