Tonight’s newsletter is focused on Southeast Missouri, where rates are the worst in the state right now. Though rates are climbing there, we see improvement in many other parts of Missouri. This extends to hospitalizations, which remain high but are either beginning to improve or have, at least, stopped growing.
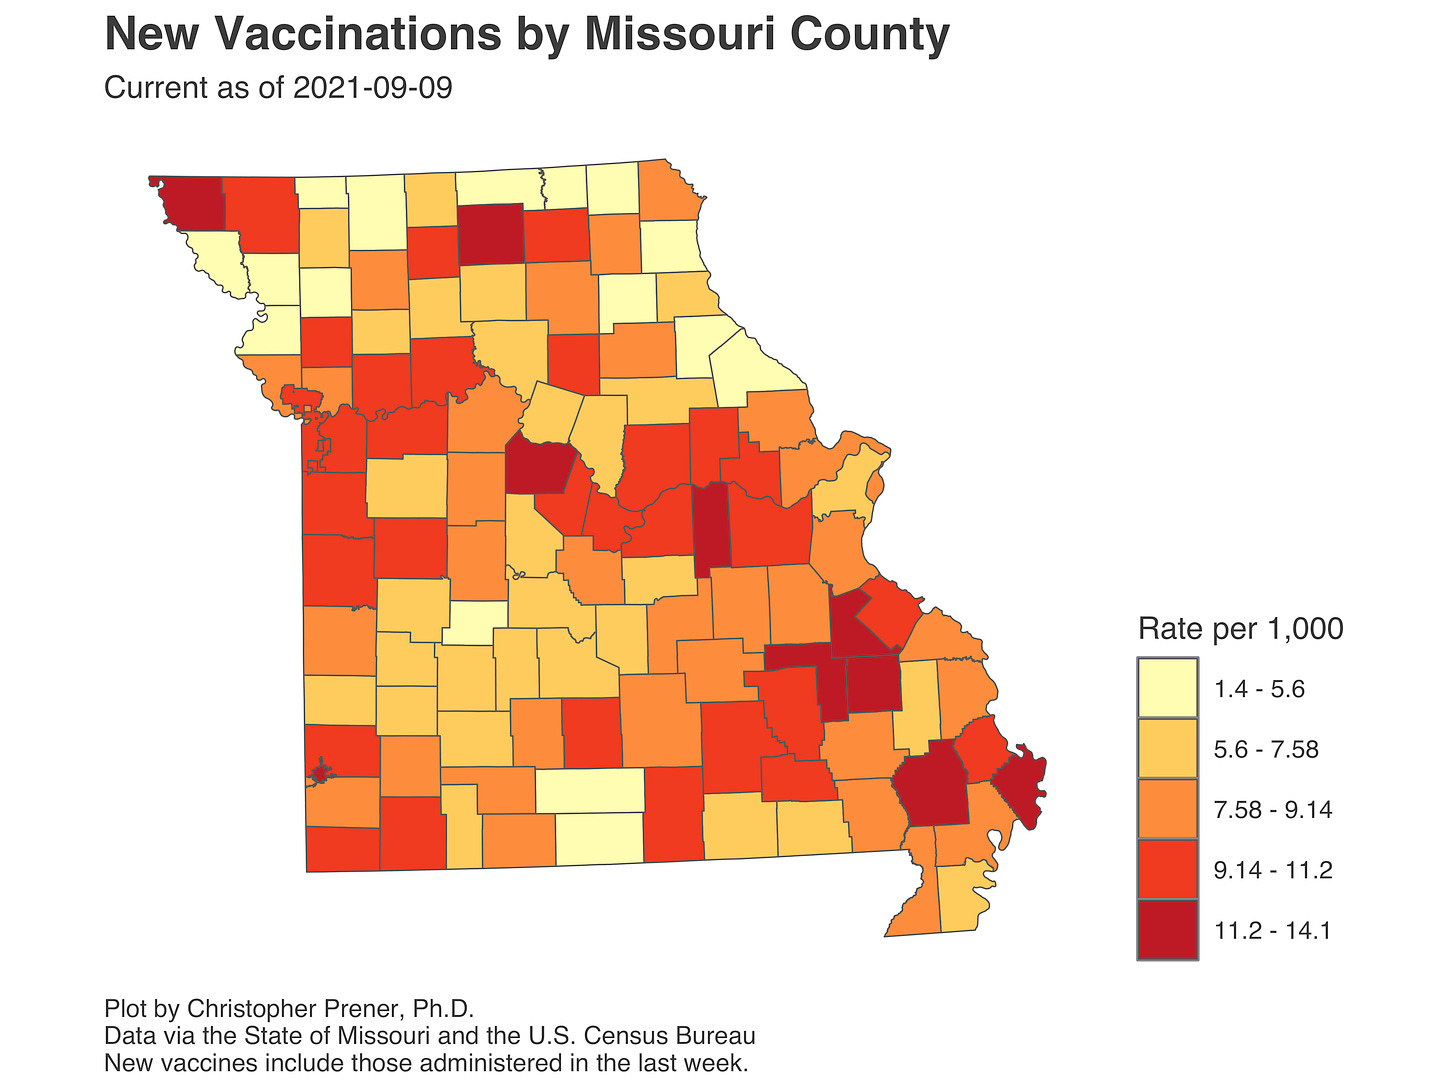
The worst news, though, is that vaccinations have slowed to their lowest level in a year. Hopefully, the announcement of new requirements today helps jumpstart our vaccination numbers. - Chris
COVID-19 by the Numbers
Total cases in MO: 792,710 (+14,986 from last Thursday)
7-day average of new cases per day in MO: 2,140.86 (-177.71 from last Thursday)
Counties with the highest per capita rates (per 100,000) of new cases per day this past week:
Carter (142.93 per 100,000), Reynolds (119.9), New Madrid (113.89), Scott (96.64), Madison (94.81), Warren (85.53), Washington (84.81), Iron (82.46), Ripley (82.42), and St. Francois (82.04)
Total deaths in MO: 11,503 (+197 from last Thursday)
7-day average of new deaths per day in MO: 28.14 (-6.14 from last Thursday)
Percent of all Missourians initiating vaccination: at least 47% (no change from last Thursday)
Percent of all Missourians completing vaccination: at least 41% (+1% from last Thursday)
Case and mortality numbers are current as of Wednesday, September 8th. Vaccination numbers are current as of Thursday, September 9th. Additional statistics, maps, and plots are available on my COVID-19 tracking site.
Illness Trends in the Past Week
What’s striking to me tonight is the continued top-line reductions in cases statewide and in many corners of the state. Our daily average number of cases has dropped by approximately 500 in “Outstate” and 850 statewide since their peaks at the very beginning of August.
At the same time, we have increased the number of counties with per capita rates above 80 new cases per 100,000 people per day. Last week, we had five counties with rates that high. Tonight, we have ten. These counties have rates three times higher than what we see in St. Louis right now and are concentrated in Southeastern Missouri.
The highest rates are in the Ozark Mountains, where Carter and Reynolds counties lead the state in terms of their 7-day averages. Carter’s rate has declined significantly from its recent peak, but its current number is about where we were at the end of August and, looking back further, since around August 20th.
Further east, the Bootheel has several counties whose rates are a bit lower but still quite concerning. We have slight declines in Butler, Mississippi, Scott, and Stoddard counties. This is all good news, though Scott in particular still has a very high rate even if it has declined. Both Scott and New Madrid counties have the third and the fourth highest rates in Missouri currently.
To the north, around Cape Girardeau, four additional counties are in our top ten - Iron, Madison, St. Francois, and Washington. These four counties are not yet seeing declines. Each remains either at a recent peak (especially Madison) or just below it.
The final area of Missouri to watch right now are in the far fringes of the St. Louis metropolitan area. Rates in these outer counties, especially Warren and Lincoln, contribute to a very flat pattern in our 7-day average here in St. Louis as cases fall sharply in most other parts of Missouri outside of the Southeast corner.
The good news is that St. Charles County is seeing some general improvement, and both St. Louis City and County continue to remain very stable in their rates of new cases. These three counties have the largest share of the metro’s population and weigh heavily on our per capita rate overall, which continues to be lower than the regional rates for Kansas City and “Outstate.”
The lower rates of new cases in the St. Louis area have contributed to our relatively low hospitalization rates, which remained the lowest in Missouri at the metro level until the end of August. The big declines in hospitalizations from mid-July in Jefferson City, Springfield, and St. Joseph are especially welcome, as is the generally plateauing of hospitalizations in our other metros.
Vaccination Trends in the Past Week
Vaccinations appear to have slowed to their lowest point since last winter when they were limited to a select number of Missourians. Some of the highest rates of recent vaccinations are now in Southeast Missouri, where cases are spiking, and in the counties along the Missouri River between St. Louis and Mid-Missouri. This decline in vaccination rates suggests that Pfizer’s full approval at the end of August has led to a rush in new vaccinations.
If you like what you see here and don’t already, please subscribe!


Thank you for the weekly updates. You’re doing great work. I would like to know if you have any data on pediatric rates? Curious to know what the current rates are now that most schools have been back a few weeks
Any chance you could run an analysis comparing new cases vs new vaccinations. Seems counterintuitive, but at this point what has made sense since this novel corona virus made its debut. Looks like there is a correlation according to the maps above.