Regular Twitter posts have returned this week, and “River City Data” is now back to my usual Friday evening schedule. Unfortunately, given my move last week, I don’t have an interview for tonight. I’m hoping to get back to sharing interviews next week. In the meantime, I hope tonight’s brief statewide update is useful. Have a great weekend! - Chris
COVID-19 by the Numbers
Total cases in MO: 462,318 (+17,008 from last Friday)
7-day average of new cases per day in MO: 3,107.86 (-334 from last Friday)
Counties with the highest per capita rates of new cases per day this past week:
Harrison (88.51 per 100,000), Christian (82.55), Polk (78.34), Barton (77.15), Ozark (71.15), Livingston (71.07), Buchanan (68.64), and Greene (66.72)
Total deaths in MO: 6,590 (+314 from last Friday)
7-day average of new deaths per day in MO: 50.29 (-2.57 from last Friday)
These numbers are current as of Thursday, January 14th. Additional statistics, maps, and plots are available on my COVID-19 tracking site.
New on the COVID-19 Tracking Site
Not new per se, but I want to remind folks that we now have a regional Kansas City map to the website.
Summary for the Week Ending January 15th
When I last wrote on January 5th, we had a clearly emerging post-holiday bump in the pace of new cases. With another ten days of perspective, the bump looks all the more apparent. For now, it does seem to have peaked. We’ve had a couple of days in a row where the 7-day average statewide has shown signs of slight declines. These declines are mirrored in St. Louis and in the “outstate” trend:
The good news is that the peak (if we’ve seen it) is well below where we were at in early December during the post-Thanksgiving bump in cases. The bad news is twofold. First, we had a much larger jump in the number of new cases than we did after Thanksgiving. Second, the overall numbers of new cases remain smilier to where we were in early November. Compared to September and October, when the numbers of PCR tests conducted each week were relatively stable (and just a bit above where we are now), we’re still seeing far more cases.
There has been a geographic shift from November, however. Before Thanksgiving, rates of new cases in Southeast Missouri were very high. In fact, this part of the state has had high per-capita rates throughout much of the pandemic. Around the Bootheel, however, rates of new cases have really dropped quite significantly:
The same is true of the region to the north, around Cape Girardeau.
In their place, though, has been high rates in two areas in particular - (1) a swath of counties in the Ozark Mountains, around Springfield, and north and west of there towards Joplin and Kansas City and (2) a group of counties from St. Joseph north and east towards Iowa.
Like Greene (where Springfield is), some of these counties saw spikes in cases earlier in the fall. Like Oregon, Howell, and Ozark, other counties have had their worst weeks of the pandemic since Thanksgiving. Ozark is currently at all-time high levels of new cases.
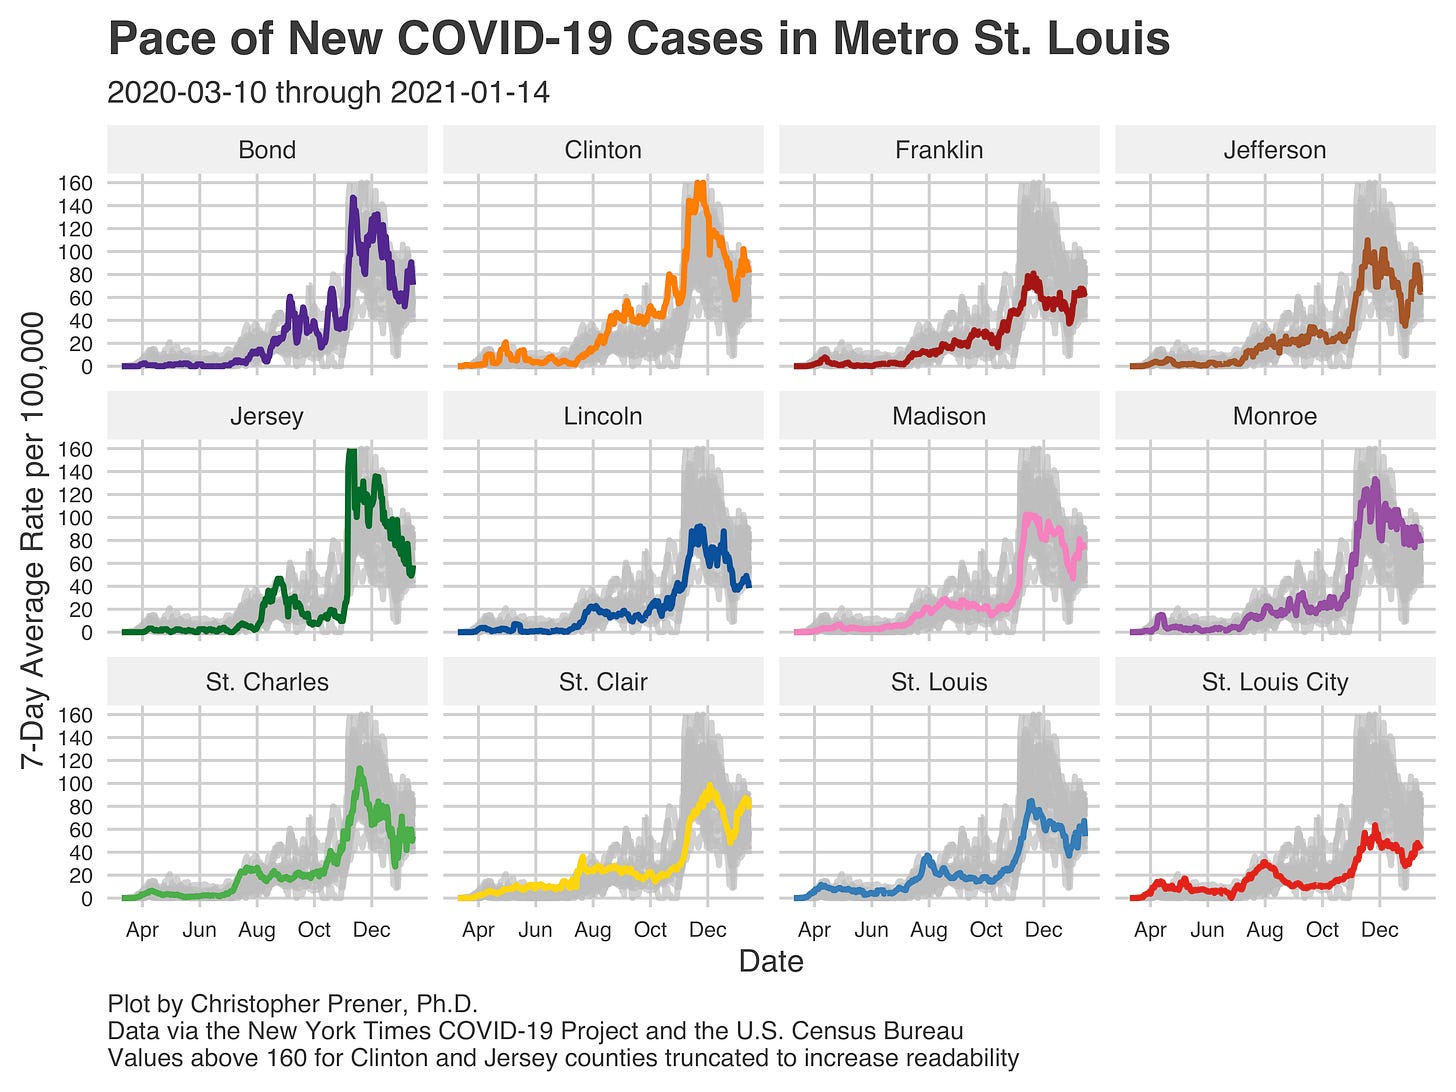
The biggest challenge for St. Louis and Kansas City is that rates in Metro East (for STL) and on the Kansas side of the metro (for KC) are higher than most counties in Missouri. This is one factor, I suspect, that is keeping St. Louis hospitalization rates so high.
This is perhaps the most important metric for me right now - I’m watching over the next week to see what happens to hospitalizations. They have been declining, but rates in St. Louis metro counties have only just peaked from their post-holiday bumps.
The slow declines in hospitalization rates may plateau given these recent bumps in cases around St. Louis. I’m also watching to see if the drops from the post-holiday uptick continue. Even if they do, however, we may very well end January with nearly a half million known, cumulative cases and over seven thousand deaths.
If you like what you see here and don’t already, please subscribe!


