As I discussed in “River City Data” No. 11, my publication schedule for early January will be a bit irregular. I am hoping to return to the every Friday schedule I used in the Fall beginning on January 15th. Thanks for your patience!
In the meantime, I’ve got a short round-up of where things stand after the holidays, a belated announcement of an update to the website, and my short interview with my SLU colleague Dr. Enbal Shacham. - Chris
COVID-19 by the Numbers
Total cases in MO: 429,745 (+8,528 from last Friday)
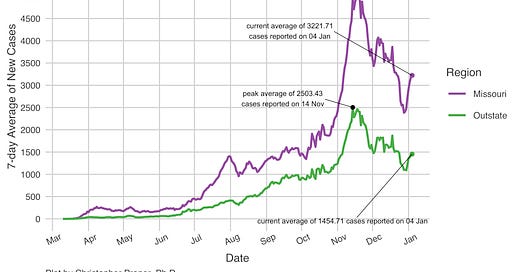
7-day average of new cases per day in MO: 3,221.71 (+292.71 from last Friday)
Counties with the highest per capita rates of new cases per day this past week:
Vernon (129.8 per 100,000), Christian (105.95), Polk (86.94), Madison (86.62), Reynolds (83.7), Cape Girardeau (77.15), Wright (75.75), Bates (75.03), and Jefferson (73.32)
Total deaths in MO: 5,941 (+35 from last Friday)
7-day average of new deaths per day in MO: 39 (no change from last Friday)
These numbers are current as of Monday, January 5th. Additional statistics, maps, and plots are available on my COVID-19 tracking site.
New on the COVID-19 Tracking Site
With the support of my all-star team of Senior Computer Science students, I’m excited to share that we’ve added a regional Kansas City map to the website. As far as I know, it is the only map of its kind. I am hoping to have a 14-day average map available later this month.
Separately, there are two data projects in the works for January:
DHHS released a nationwide data set of hospitalizations by hospital in December. I am working on a similar set of maps to how we share nursing home data. These will have both hospital and county-level maps for Missouri plus the Kansas, Illinois, and Oklahoma counties in MO metro areas. Just like the nursing home data, it will be updated weekly.
The regional maps currently have three regions - St. Louis, Kansas City, and “outstate.” I’ve been unhappy for a while with the “outstate” designator. I am working on using CDC urban-rural county classifications to break down “outstate” further.
Once those changes have been published, I hope to bring testing data back to the site later this winter. I am also hoping that as we progress through vaccinations, those data will be made publicly available and can also be integrated into my site. Stay tuned!
Summary for the Week Ending January 5th
We’re now ten days past Christmas in terms of COVID-19 data, and the pattern that is emerging feels clear so far. Before Christmas Day, case counts were trending downward after peaks in November both statewide and in many jurisdictions within Missouri. New case counts bottomed out on Christmas Day, with just 1,186 new cases registered by the New York Times (my data source for these data).
After Christmas Day, we saw the numbers of new cases reported daily climb steadily for a week before experiencing another drop on New Year’s Day. After January 1st, however, daily counts of new cases have started to climb again. The 7-day averages, on the other hand, have risen steadily since they reached lows on December 28th.
The post-Christmas bump that I’m describing here is clearest statewide. It appears in the “outstate” trend and St. Louis at the regional level. It also appears in every metro area, though Columbia and Kansas City have seen the smallest bumps:
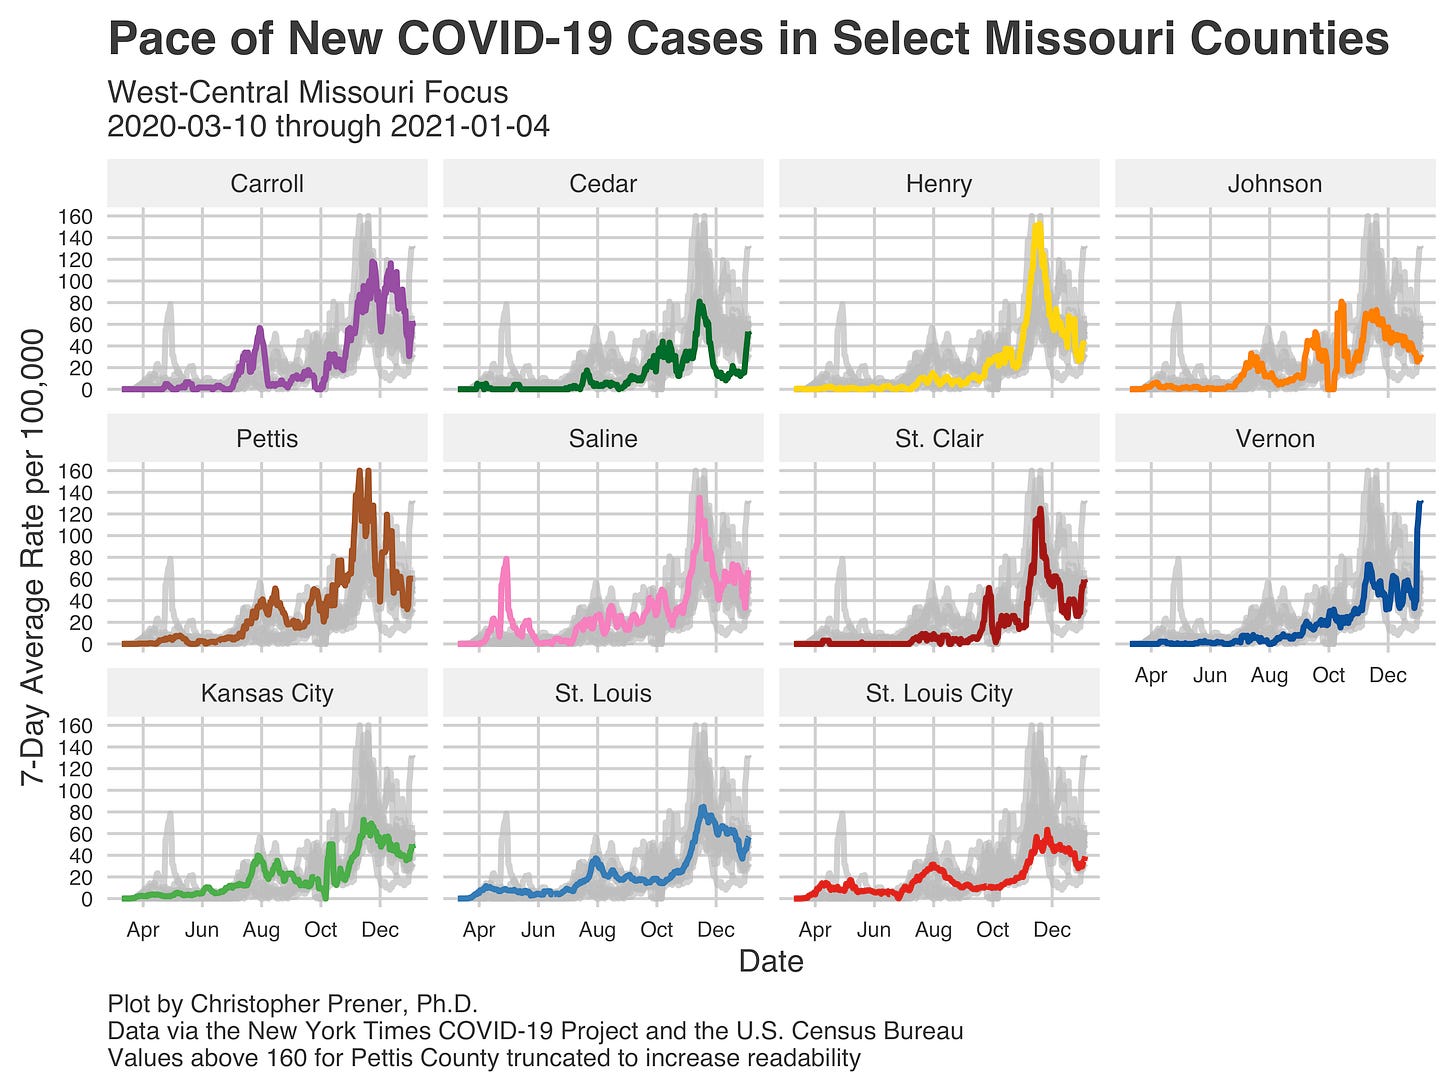
So far, the numbers of new cases are dwarfed by the rate of new cases we saw in November, but the trend is worrying nevertheless. Geographically, we’re seeing increased rates of new cases in and around Springfield, Missouri, as well as sporadic areas south of St. Louis. These include a few counties that are part of the St. Louis Metro, including Franklin, Jefferson, and St. Charles counties.
They also include a few counties that have not been on my radar south of Kansas City - Cedar, St. Clair, and Vernon counties. Vernon County now has the highest rate of new cases in the last week per 100,000 residents in Missouri:
Vernon County is an excellent example of a county that had been primarily passed over to this point. It isn’t the only county in rural parts of Missouri that has yet to really experience a large spike in cases.
One final point - the spike in new cases we’re also seeing may be larger than what we experienced in Missouri after Thanksgiving. This should give folks pause as we head into January. We’ll have a better sense of just how durable this spike is next week.
Weekly Interview
This week’s interview is with Dr. Enbal Shacham, who is a colleague of mine at Saint Louis University. She is a Professor in our College for Public Health and Social Justice and a co-leader of the GeoSLU initiative. Dr. Shacham’s research with colleagues including Dr. Alex Garza on local mask ordinances is available as a pre-print (it has not yet been peer reviewed).
CP: You’ve received some great press for your paper on the effect of mask mandates in the St. Louis area. Can you summarize your findings for folks?
ES: Mask mandates work. We were able to identify that over a 12 week period of time, we saw a 40% reduction in the rate of daily new COVID-19 infections among St. Louis City and St. Louis County. In comparison, these rates did not drop in St. Charles, Jefferson, or Franklin Counties, all of whom did not have a mask mandate during the study period. Now, St. Charles is the only county in our 5 county region that still has no mask mandate.
CP: What are your biggest public health concerns right now in St. Louis based on where we’re at with the pandemic?
ES: We continue to run our response to the pandemic using infection and hospitalization rates. That’s not a timely response, we can and must do better. The biggest public health concerns are still the ones with which we started this pandemic. We lack the infrastructure that creates healthy environments for our all residents where they work, play, and live. Further, we have continued to lack a comprehensive response to COVID-19, limited mitigation strategies that are not comprehensive across jurisdictions—including closing certain types of businesses, mask mandates, unclear schooling plans that are not based in local COVID-19 data. The hospitals are our last line of defense and they are stretching capacity, turning patients away, needing them to reschedule or individuals are not receiving the care they need. We will feel this health impact for many years to come.
CP: Are there things you wish were part of our public discourse on COVID-19 that you're not seeing?
ES: Our public discourse is missing leadership that unites. We have had a fragmented response to this pandemic, yet there is no voice that is overcoming the others that states this is urgent, we all need to work in the same direction immediately to reduce morbidity and mortality.
CP: I’m also interested in your perspective on how we train epidemiologists and public health practitioners moving forward. Do you see MPH curriculum changing because of the pandemic?
ES: There are several components that I see as building the public health infrastructure, with that the workforce. Some of those include, significant training in project management, data systems, and integration of systems across communities.
CP: Finally, what is giving you hope right now?
ES: Science. We have learned so much in so little time, we better understand the spectrum of disease, patterns of infection, and effective vaccines. Pretty tremendous in a relatively short period of time.
If you like what you see here and don’t already, please subscribe!


