Tonight, we have a clear shift in our illness trends both statewide and specific counties. The macro trend statewide is that new case rates have stopped falling, at least for now. The county-level trend is that we are seeing plateaus and even slight increases in new case rates. As I say below, bumps happen. We should not overreact to every single growth. That said, as we head indoors and move into the holiday season with Thanksgiving as well as Hanukkah and Christmas, these patterns are worth watching very closely. So, while the shift is clear, we do not yet know where our case counts will go. - Chris
COVID-19 by the Numbers
Total cases in MO: 868,264 (+6,909 from last Thursday)
7-day average of new cases per day in MO: 987 (-66.29 from last Thursday)
Counties with the highest per capita rates (per 100,000) of new cases per day this past week:
Sullivan (63.32 per 100,000), Lewis (54.14), Vernon (43.5), Perry (43.28), Knox (39.77), Nodaway (38.65), Clark (35.71), Holt (35.27), and Scotland (35)
Total deaths in MO: 12,747 (+96 from last Thursday)
7-day average of new deaths per day in MO: 13.71 (-6.29 from last Thursday)
Percent of all Missourians initiating vaccination: at least 50% (no change from last Thursday)
Percent of all Missourians completing vaccination: at least 45% (no change from last Thursday)
Case and mortality numbers are current as of Wednesday, October 27th. Vaccination numbers are current as of Thursday, October 28th. Additional statistics, maps, and plots are available on my COVID-19 tracking site.
Trends in the Past Week
Compared to last week, our seven-day average is down again by just short of two-hundred cases. The continued decline seems like great news, and it is, but a shorter-term trend is unfolding. The seven-day average actually fell even further earlier this week, down to about 950 new cases per day on average, before rebounding to near 1,000. You can see this uptick in the Kansas City area in particular. If you look closely below, you can see the slight uptick. There is a minor bump “Outstate,” and a plateau in St. Louis.
I do not want to overstate this. If you look earlier this fall, you will see that bumps happen. The same is true as cases declined during December, January, and February last winter. So, bumps happen. Things may even be marginally better than last week, where we saw several counties experiencing small spikes above 40 new cases per day per 100,000 on average. However, that number has shrunk again this week. So the variation we see right now is more about a more significant number of counties experiencing slight increases or pleateaus rather than large spikes in new cases.
The number of counties in the mix with relatively higher rates of new cases has shrunk, too. There are a couple of Southeastern Missouri counties and some east and south of Kansas City. The majority of higher rate counties are in Northern Missouri, however.
In Northeastern Missouri, Clark, Knox, and Lewis counties all have some of the highest rates of new cases in the state. Pay attention to Pike County as well - this is the type of slight increase we see elsewhere in Missouri.
Scotland County has seen some wild swings, but this is an artifact from a small number of new cases in a tiny population jurisdiction - the 2020 Census estimated that about 4,700 people live there.
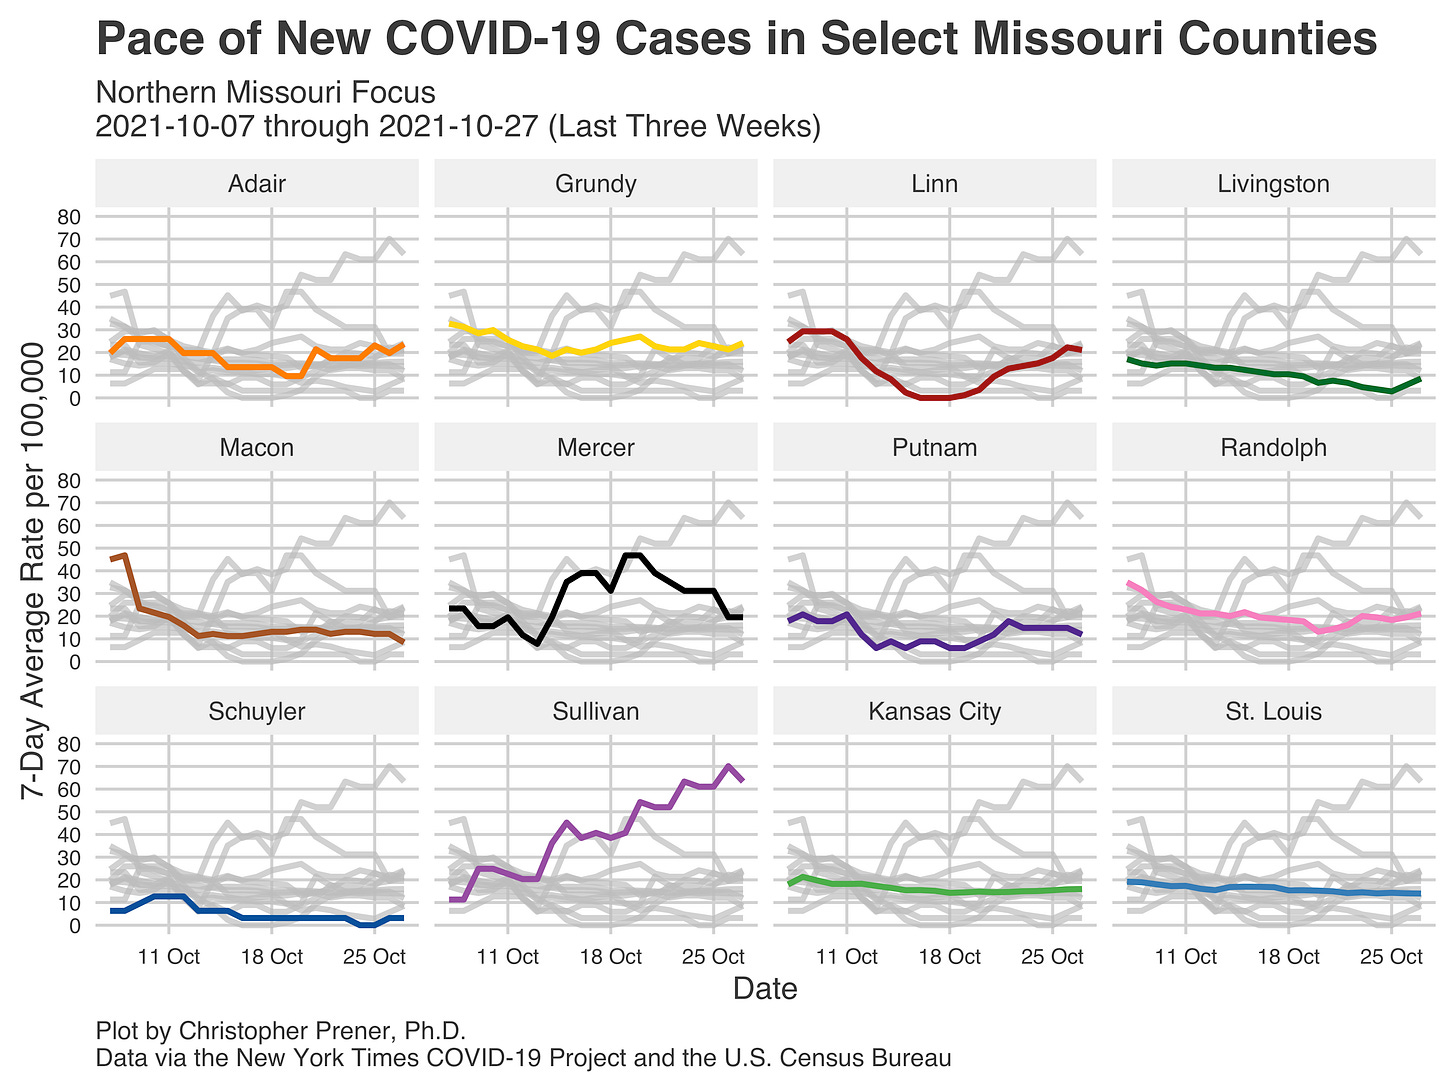
Further west, Sullivan County has the highest rates of new cases in Missouri right now. Sullivan’s rate of new cases has been on the upswing for several weeks now. It is a county that is worth watching closely. Northern Missouri counties were the first in the state to see a significant surge in new cases this past May when Missouri began to lead the United States in Delta cases. If Sullivan’s increases continue, it could signal that a second Delta wave is possible in other parts of Missouri this winter.
Elsewhere, look at the slight upticks in new cases in Adair and Linn counties. These are similar to Pike County in Northeastern Missouri.
Further west, we see even more of these modest upticks. As you read on, keep in mind that the y-axis range has shrunk in each of these successive plots. Nodaway, Holt, and Daviess counties have the same sort of slight increases I have mentioned elsewhere in Northern Missouri.
We have more of these slight increases in the counties between the Kansas City metropolitan area and Mid-Missouri. Here, too, we have seen slight upticks over the past few weeks. Vernon and Henry are among the notable counties to watch, but so too are jurisdictions like Pettis and Saline counties.
Finally, for tonight, another notable trend is the pause in hospitalization declines during mid-October. It will be interesting to see what happens with these trends over the next few weeks, particularly if rates of new cases do not continue to decline.


