We have four wildly divergent stories unfolding right now with COVID-19 case trends in Missouri. Nothing underscores the shifting patterns more than the list of counties with the highest new rates below. Last week’s list was made up entirely of counties in the St. Louis and Kansas City metros, with the lone exception of Boone County. This week’s list contains no counties in either of those major metros.
Moreover, rates have shifted upwards - last week, the highest rate was in St. Charles County, which came in at 284 new cases per 100,000 residents per day on average. This week, that would qualify for the middle of the list. Indeed, half the counties in last week’s list are below Joplin’s current rate.
Boone County, which is currently at 309 new cases per 100,000 residents per day on average, now has the fourth-highest new case rate of any county in Missouri at any point in the pandemic (excluding days dramatically affected by reporting issues). Number three on that list was Boone County yesterday. Today’s rate is just nine cases from the worst seven-day average recorded, and we have had fewer than fifteen days since March 2020 when a county has had a new case rate above 300.
So, we’re seeing a geographic reshuffling of high rate counties, and the highs now are outpacing the highs we saw last week. Hospitalizations, critically ill patients, and deaths are also rising. The end of our Omicron wave, then, is still a long way off. - Chris
COVID-19 by the Numbers
Total cases in MO: 1,234,661 (+84,531 from last Thursday)
7-day average of new cases per day in MO: 12,075.86 (+684.43 from last Thursday)
Counties with the highest per capita rates (per 100,000) of new cases per day this past week:
Boone (309 per 100,000), Pulaski (297.72), McDonald (294.14), Scott (288.08), Pettis (275.12), Dunklin (274.65), Cole (273.09), Shelby (268.7), Vernon (257.53), and Joplin (256.77)
Total deaths in MO: 16,996 (+242 from last Thursday)
7-day average of new deaths per day in MO: 34.57 (-9 from last Thursday)
Percent of all Missourians initiating vaccination: at least 57% (no change from last week)
Percent of all Missourians completing vaccination: at least 51% (no change from last week)
Case and mortality numbers are current as of Wednesday, January 19th. Vaccination numbers are current as of Thursday, January 20th. Additional statistics, maps, and plots are available on my COVID-19 tracking site.
Trends in the Past Week
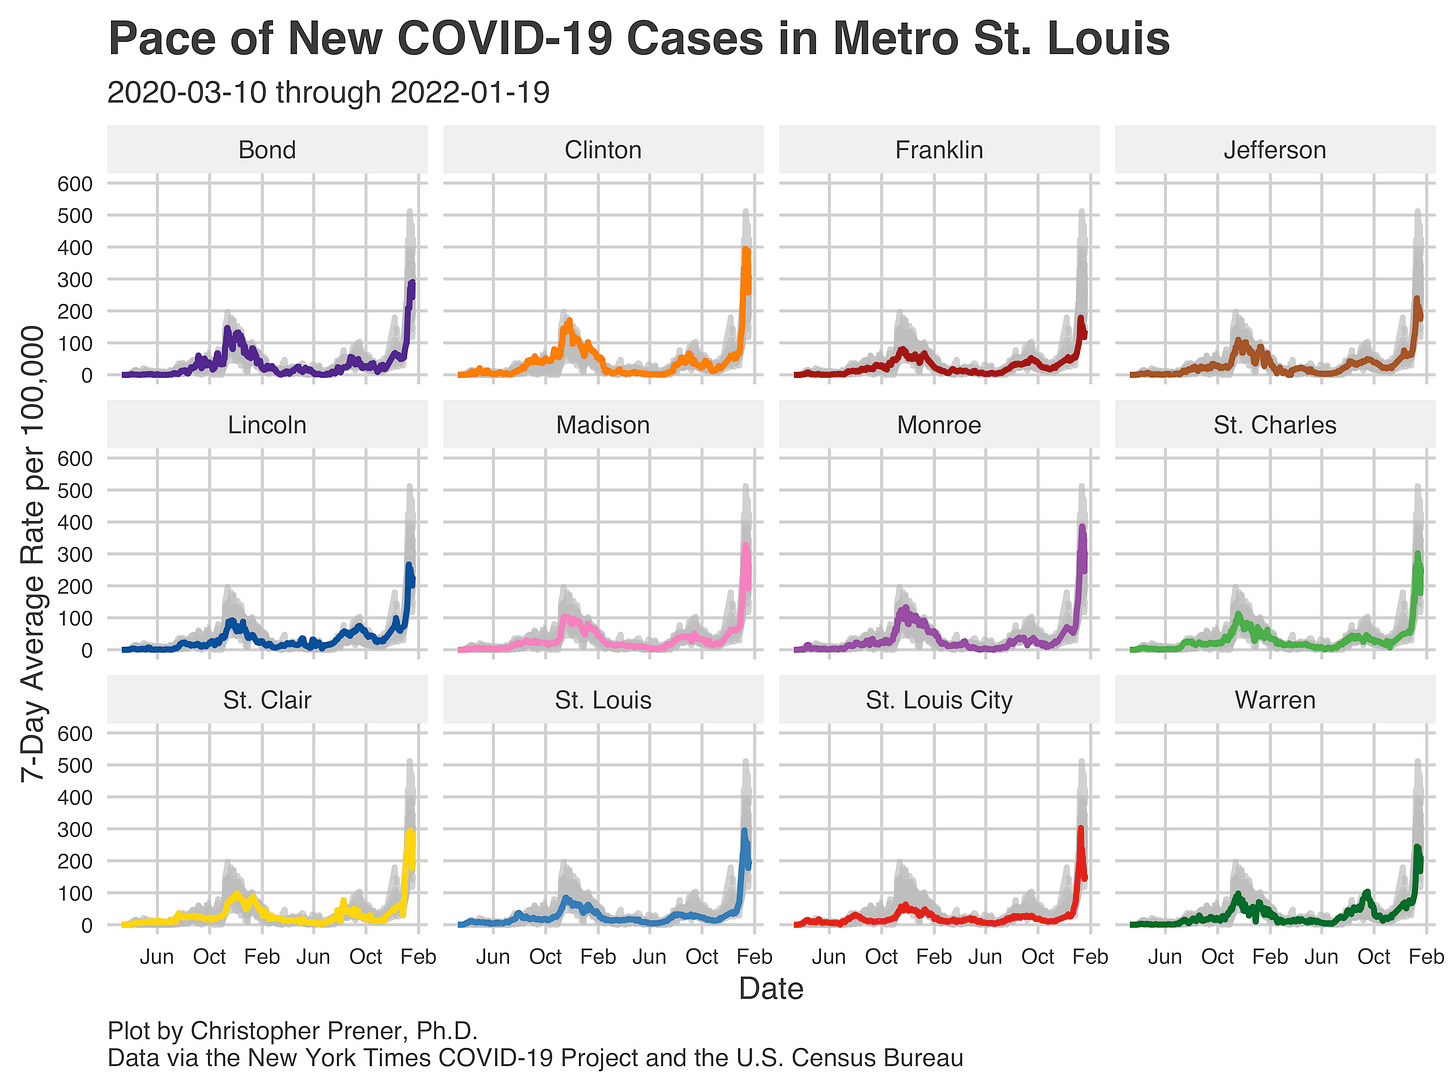
Three of the four stories we have with COVID at the county level in Missouri are visible below. St. Louis looks to be well past its peak from Omicron. If you exclude a one-day spike for Kansas City a couple of weeks ago, the pattern there looks to be just below the general peak of new cases. Then there is Outstate Missouri, which now has a higher rate of new cases than St. Louis.
In St. Louis, rates have fallen dramatically in both the City and the County. In other counties, the declines are apparent but not as large so far. Franklin County, for instance, is a bit lower but only by about 25 new cases per 100,000 people per day. Notable, but a far cry from the drop we see in the metro’s core.
One cautionary note is that, while rates are declining, they are still well above any prior high. That includes both St. Louis City and County, which would need to drop by nearly 100 new cases per 100,000 per day to reach their previous peaks from the fall/winter ‘20 surge.
In Kansas City, where new case rates may have peaked, we are not yet seeing declining rates of new cases. The lone exception is Kansas City itself, where the rate of new cases has fallen substantially. Leavenworth County has just hit a higher rate than we saw before the Martin Luther King Junior holiday.
Right now, at least in new cases, the most concerning trends are in Outstate Missouri. As I said above, there are four patterns, and the last two are here in Outstate. First, we have counties like Boone surging to incredible highs. Though Cole has dropped somewhat, its highest value of the pandemic was just shy of 300. As a reminder from above, high rates are very rare for Missouri counties, and even rates in the 200s were rare before the Omicron wave.
Rates in Boone, Callaway, and Cole all contribute to striking metro rates. Columbia has far and away the highest rate of new cases of the entire pandemic. Jefferson City is right where St. Louis and Kansas City each peaked earlier this month.
My biggest concern, just beyond the sheer magnitude of these numbers, is that the University of Missouri’s main campus returned to classes this week amidst these unprecedented levels of transmission in Mid-Missouri without requiring community members to mask or get vaccinated. Therefore, I am pretty pessimistic about what the next week looks like in Boone County and surrounding areas.
I am also pessimistic about large swaths of Outstate Missouri right now. The lightest color band ranges from a low of 51.5 to 102 - I don’t recall seeing the lowest category of new case rates containing values this high. Many rural counties on this map are experiencing surging rates of new cases.
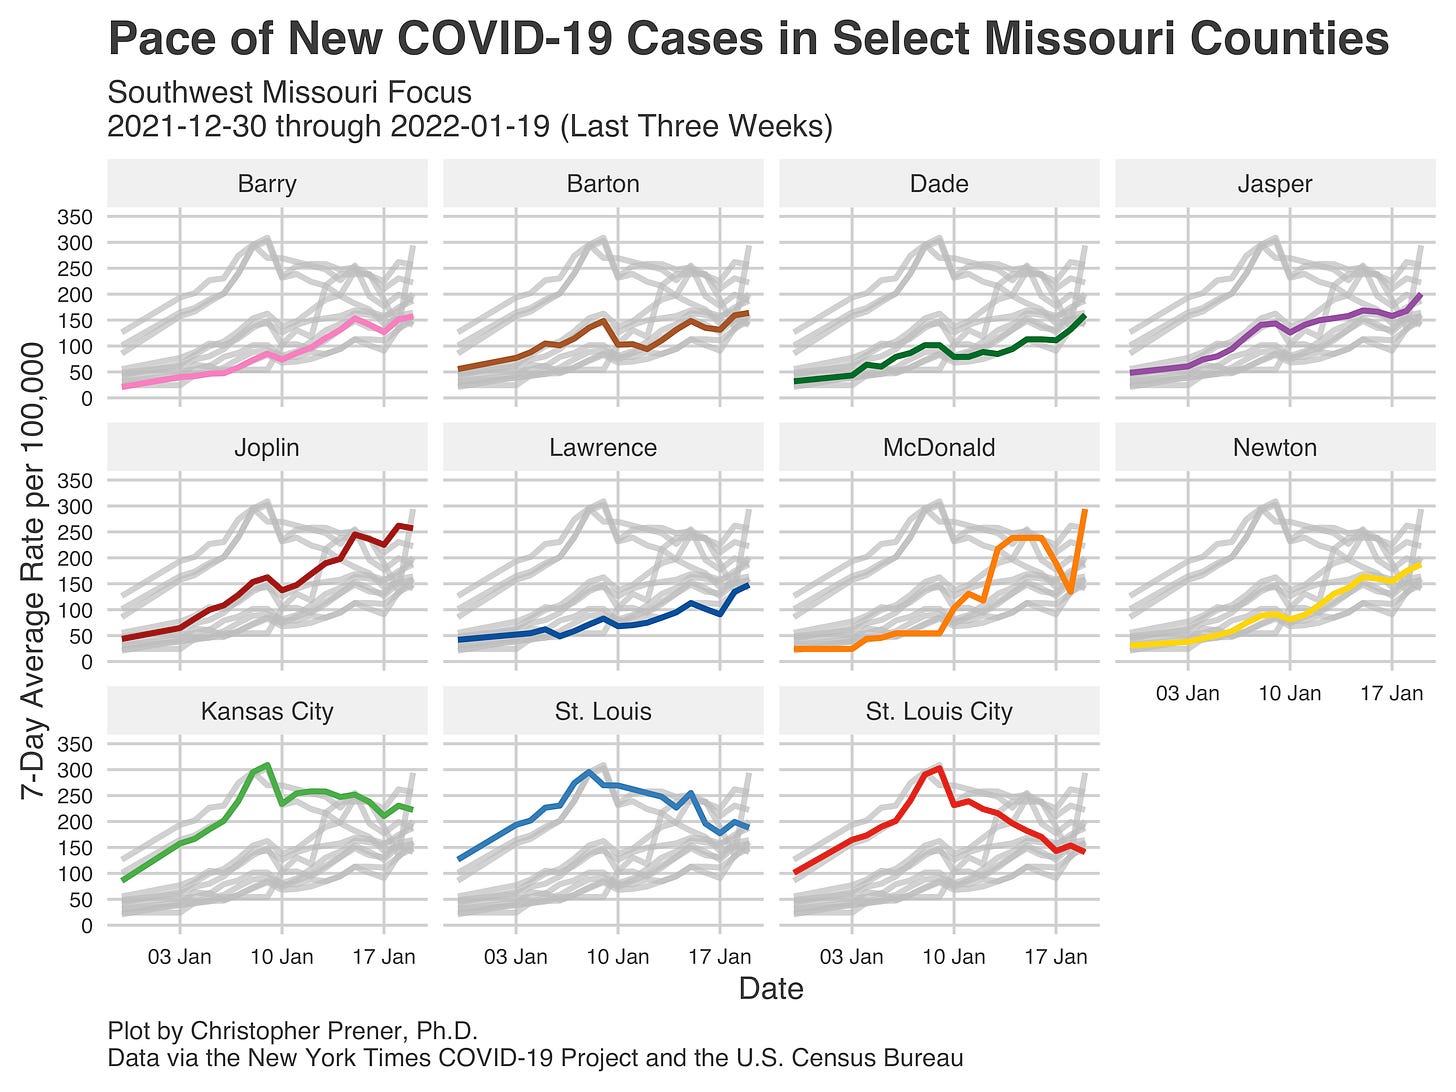
For example, Southwest Missouri has steadily climbing rates of new cases in every single one of the eight counties I have lumped together in that region. McDonald County is approaching the rare distinction of 300 new cases per 100,000 residents per day on average. Yet, amazingly, this is still below the per capita rates it experienced at the beginning of the pandemic, which remains the highest seven-day average we have seen - 317.9 per 100,000 residents per day.
Rates are similarly high around Lake of the Ozarks, with Pulaski County, home of Fort Leonard Wood, registering the second-highest rate of new cases in Missouri right now behind Boone County. Interestingly, I got some pushback this summer when I highlighted spikes in new cases around Lake of the Ozarks that claimed (erroneously) that high rates were due to tourists, not locals. But, of course, it is much harder to make that false claim now.
There are few places not experiencing these high rates. In Northern Missouri, Linn, Mercer, and Schuyler counties are some of the only in the entire state not seeing their rates beginning to tick up steeply towards 100 or more new cases per 100,000 residents per day. Yet, even among these three counties, rates are still up from prior lows before Omicron.
Beyond new cases, hospitalizations are pushing new highs around Missouri. As of early January, every metro was experiencing a steep spike in in-patient numbers. Cape Girardeau and Columbia have the least remarkable increases, yet their hospitalization numbers have tripled since early November. I anticipate seeing significant gains to both metros’ numbers as we get more complete data for January.
In St. Louis, our seven-day average has surpassed 1400 new cases. About forty of these patients are hospitalized at the Veterans Affairs hospital in St. Louis City. This week, we started getting their data added into St. Louis Pandemic Task Force reports. Had this not happened, our seven-day average would still be very close to 1400, but it is driving a slight increase in our numbers compared to prior weeks.
The number of patients requiring ICU care also remains at its highest level of the pandemic, comparable only to the first days of April 2020 when doctors were aggressively intubating patients.
The overall proportion of patients requiring ICU care is at its lowest level of the pandemic, as is the ratio of patients requiring mechanical ventilation. This paradox is critical to understand in light of the “Omicron is milder” narrative. Yes, we are seeing lower rates of critically ill patients, but there are so many patients that even a smaller percentage of patients requiring ICU care leads to all-time highs. Mortality is in a similar place, with a seven-day average of just two deaths per day lower than our peak in December ‘20.
By every measure, then, we a long way from the end of the Omicron wave, even if we may have peaked in the St. Louis and Kansas City areas. So, do not be distracted by the downturns I am going to talk about below - they represent good news, but for nearly half of Missourians, we are not yet at the peak of new cases. Moreover, any peak of new cases means peaks for hospitalizations could still be weeks away, a daunting prospect for exhausted health care providers.


