We’re in a much better position than we have been in quite a few weeks here in Missouri. However, we’re also in an awkward phase of the pandemic where metrics are showing improvement but remain far higher than their pre-Omicron levels. So, celebrate falling case levels and the beginnings of progress in our hospitalization data, but remember that we are far from being done with Omicron. - Chris
COVID-19 by the Numbers
Total cases in MO: 1,310,814 (+76,153 from last Thursday)
7-day average of new cases per day in MO: 10,879 (-1,196.86 from last Thursday)
Counties with the highest per capita rates (per 100,000) of new cases per day this past week:
Henry (277.64 per 100,000), Greene (273.85), Pettis (271.75), Madison (271.55), Andrew (270.07), Christian (267.83), Callaway (265.07), St. Clair (263.39), Dallas (263.22), and Howell (258.63)
Total deaths in MO: 17,345 (+349 from last Thursday)
7-day average of new deaths per day in MO: 49.86 (+15.29 from last Thursday)
Percent of all Missourians initiating vaccination: at least 57% (no change for last two weeks)
Percent of all Missourians completing vaccination: at least 51% (no change for last two weeks)
Case and mortality numbers are current as of Wednesday, January 26th. Vaccination numbers are current as of Thursday, January 27th. Additional statistics, maps, and plots are available on my COVID-19 tracking site.
Trends in the Past Week
Our case data tonight show across-the-board improvements at the regional level. Cases in the Missouri side of the St. Louis metro have shown the most improvement as a group - they’re just about half of what they were at their peak back in early January. Kansas City’s decline is becoming more apparent - the Omicron wave plateaued in a way that it has not in St. Louis.
Outstate Missouri now has a higher per capita rate than either St. Louis or Kansas City and, while it is declining, there are quite a few counties that still have very high rates. Indeed, despite the overall improvements, the top-ten list’s per capita rates (see above) look pretty similar to the values we saw last week. Mid-Missouri, Northwest Missouri, areas around Springfield, and Southeast Missouri are the most impacted by new cases this week.
For all of the areas I just named except Southeast MO, the trend looks pretty similar to what we see in Greene County and the surrounding area. Again, there is a clear pattern of ebbing new case rates that could very well turn out to be these areas’ peaks of new cases.
This is cautious good news because there is no guarantee that these are the peaks, and the rates in every one of these counties remain very high.
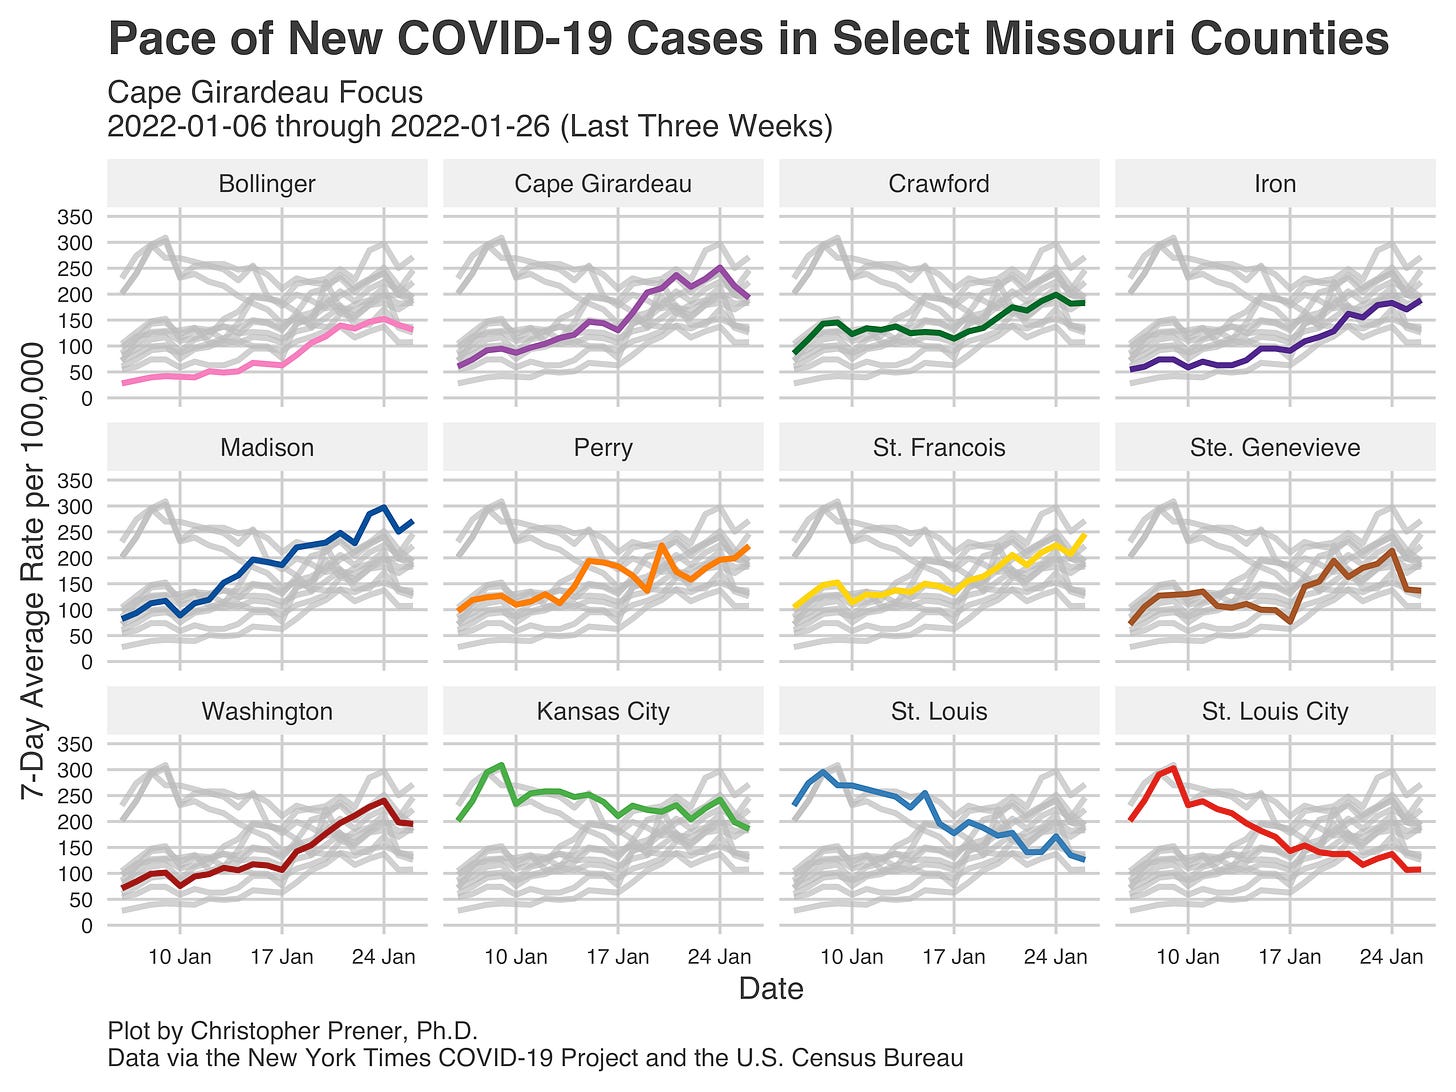
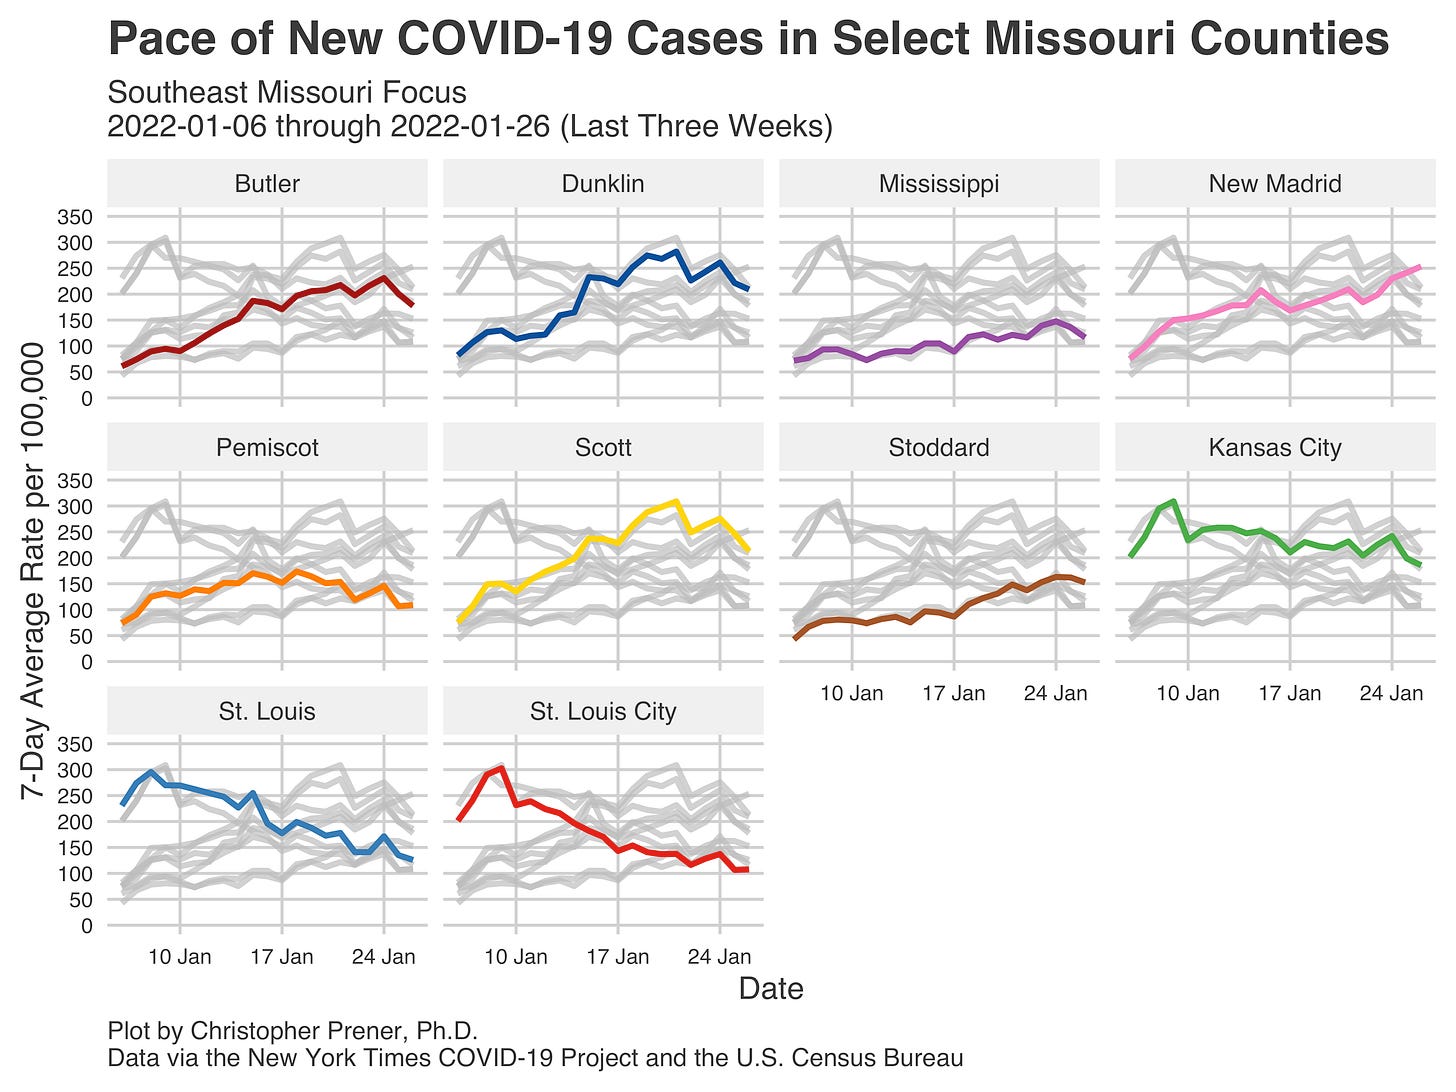
Southeast Missouri is the one area where we see increases that stand out this past week. It is not uniform - trends in Cape Girardeau, Butler, Dunklin, and Scott counties’ trends, for example, look much more like Greene County. However, others, including Iron, Madison, Perry, St. Francois, and New Madrid, are not showing signs of reaching their Omicron peaks yet.
You can see the steady improvement in St. Louis City and County on both these plots, as well as the less dramatic but still steady improvement in Kansas City.
We have yet to see a steady improvement in hospitalizations. The data do lag behind cases, but I don’t anticipate seeing significant improvements outside of St. Louis for a little while yet. Jefferson City and Columbia have reached new all-time highs in hospitalizations, and I would not be surprised to see Joplin, Springfield, and St. Joseph set similar records in the next few weeks.
Our St. Louis data is up-to-date and has some cautiously good news - each of our key metrics looks like the plot of total hospitalizations below, which are beginning to fall away from their mid-January highs.
The most crucial point that I want to continue to emphasize is that the “mildness” of Omicron certainly seems to be playing out here - the ratios of critically ill patients have never been lower.
Still, it is so transmissible (and our vaccination rates are so low) that we have not been able to avoid the more moderate hospitalization and mortality patterns other places have experienced. Instead, COVID patients inundated our hospitals. With mortality, the picture is still unfolding. We know from St. Louis hospitals that mortality has been far higher than during our Delta wave and nearly as high as our peak last winter.
Statewide, the picture remains murky. The State’s data processing appears to have slowed over the holidays, but there is a clear bump in mortality that outpaces the very first wave of COVID cases in Missouri, even with that slowdown. What worries me is the spike in mid-January of reported deaths that is sharply divergent from the red line, reflecting confirmed deaths from the State. Those confirmed deaths are constantly revised, and so over the next few weeks, we can expect numbers from December and January to be continually adjusted.
One clue about how those revisions will unfold lies in past spikes we have experienced. For example, look at the patterns in the sharp increases of reported deaths in December 2020 and September 2021. In each case, though we did not know it at the time, the actual deaths show that the real peaks occurred a month prior. It is possible that we ultimately find that deaths during the latest December-January wave peak at higher numbers than the Delta wave this past summer. Even if the ratio of cases to deaths is far different than prior waves, that is still a staggering number of Missourians who have lost their lives since Thanksgiving.


