It feels like every passing day of data right now points to a worsening picture in Missouri. I am growing increasingly pessimistic about the situation in Missouri and what the next few months look like, given that are no signs of the patterns I discuss below changing. Instead, trajectories of new cases and hospitalizations point to a situation that is growing increasingly untenable, especially without renewed public health interventions.
I also want to draw folks’ attention to an excellent piece just out in The Atlantic. Ed Young, who won a Pulitzer Prize for his reporting on the pandemic last year, has just written an article about what health care providers are experiencing in Springfield’s major hospitals. Please share it widely.
Be well, and please get vaccinated if you have not yet done so! - Chris
COVID-19 by the Numbers
Total cases in MO: 656,322 (+12,536 from last Friday)
7-day average of new cases per day in MO: 1,790.86 (+713.43 from last Friday)
Counties with the highest per capita rates (per 100,000) of new cases per day this past week:
Taney (108.6 per 100,000), Dallas (80.52), Buchanan (78.91), Gentry (77.16), Greene (76.23), Dade (75.29), Wright (74.97), and Jasper (73.69)
Total deaths in MO: 10,095 (+95 from last Friday)
7-day average of new deaths per day in MO: 13.57 (+4.71 from last Friday)
Percent of all Missourians initiating vaccination: at least 40% (+1% point from last Friday)
Percent of all Missourians completing vaccination: at least 35% (+1% point from last Friday)
Case and mortality numbers are current as of Thursday, July 15th. Vaccination numbers are current as of Friday, July 16th. Additional statistics, maps, and plots are available on my COVID-19 tracking site.
Illness Trends in the Past Week
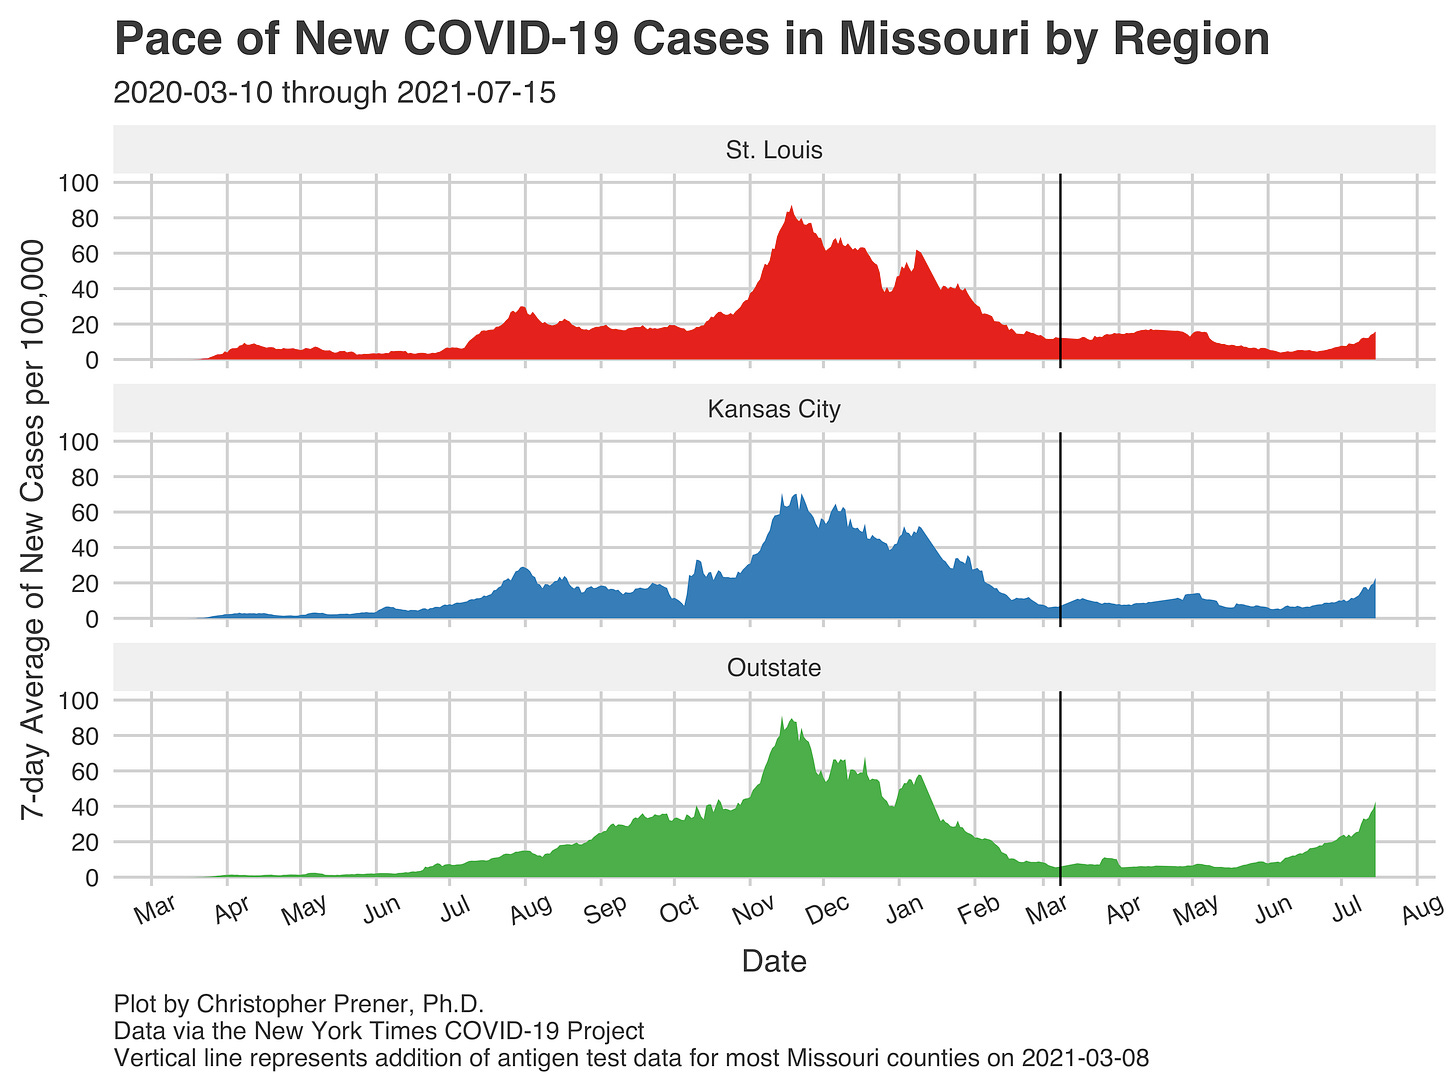
Rates of new cases in Missouri have climbed very steeply over the past week. Especially in outstate Missouri, we are now into over a month of sustained, steady increases. The last time we were at this point outstate, now 40 new cases on average per 100,000 people, was mid-January. What is especially concerning is that the increases are becoming steeper and steeper.
In St. Louis and Kansas City, the increases are a newer phenomenon but are also becoming steeper. Right now, rates in Kansas City are half of what they are in outstate Missouri and are comparable to early February. In contrast, St. Louis continues to have the lowest regional rates, with rates comparable to early May. However, that is poised to change; I would not take much comfort in our relatively low case numbers.
The overall number of new cases statewide is also eye-catching. We’re now averaging nearly 1,800 new cases per day, a place we were last at in very late January.
These statewide trends, and the outstate rate, in particular, are being influenced by what is happening across a massive stretch of Mid to Southwest Missouri. The area of concern begins on the I-70 corridor near Columbia, MO, from Saline County east to Montgomery County. It stretches south through Lake of the Ozarks all the way to the Arkansas state line and west to the Kansas state line.
This is actually part of a larger cluster of new cases that begins in Southeast Kansas and Northeast Oklahoma, includes this large area of Missouri, and then stretches south through much of Arkansas. This “Ozark cluster” has pushed Arkansas and Missouri into the top two spots nationally among states and territories for new cases. The New York Times maintains a list of counties with more than 10,000 residents. As of this writing (midday on June 16th), Missouri counties occupied six of those ten slots. Baxter County, Arkansas, is also on the list, meaning seven of ten slots are part of this cluster.
No counties have had their case rates shift more profoundly than around Springfield. In addition, Dallas and Taney counties have now surpassed their seven-day averages from earlier in the pandemic (though you should note that comparisons like this are a bit tricky - see my tweet thread on the subject). Nonetheless, case rates this high are quite worrying, especially since Greene, Stone, and Webster are all nearing all-time highs as well.
The pressure this is placing on hospitals is tremendous. Mercy’s Chief Administrative Officer in Springfield, Erik Frederick, tweeted in the last few days that they had opened a sixth COVID unit when they only needed five during the fall and winter of 2020. Though their in-patient numbers have held around the low 130s in recent days, Frederick also shared today that they are planning for those numbers to grow to somewhere between 180 and 200 by mid-August. Cox Health likewise has about 140 in-patients right now.
The “Ozark cluster” is spreading outward, too. The counties I highlighted east of Branson and west of Butler County are seeing steep increases in new cases right now. I highlighted this area back at the beginning of June as an area I was very concerned about. It continues to have the perfect combination of low overall rates of COVID-19 infections and low levels of vaccinations (even by Missouri’s dreadful standards). Taken together, there is a larger proportion of the population there that is at the greatest risk for infection than anywhere else in Missouri. Case rates have risen dramatically in Carter, Douglas, Howell, Ozark, Texas, and Wright counties.
This is not the only area I am worried about. In both the Kansas City and St. Louis metropolitan areas, we have pockets of meager vaccination rates. In St. Louis, North City, in particular, is an area of concern, as is North County. These areas are already seeing case rates increase, and hospitalizations and ICU numbers are headed up steeply in St. Louis. These signs all point to the COVID situation continuing to deteriorate in Missouri over the next few weeks, perhaps with ever-increasing rapidity.
Vaccination Trends in the Past Week
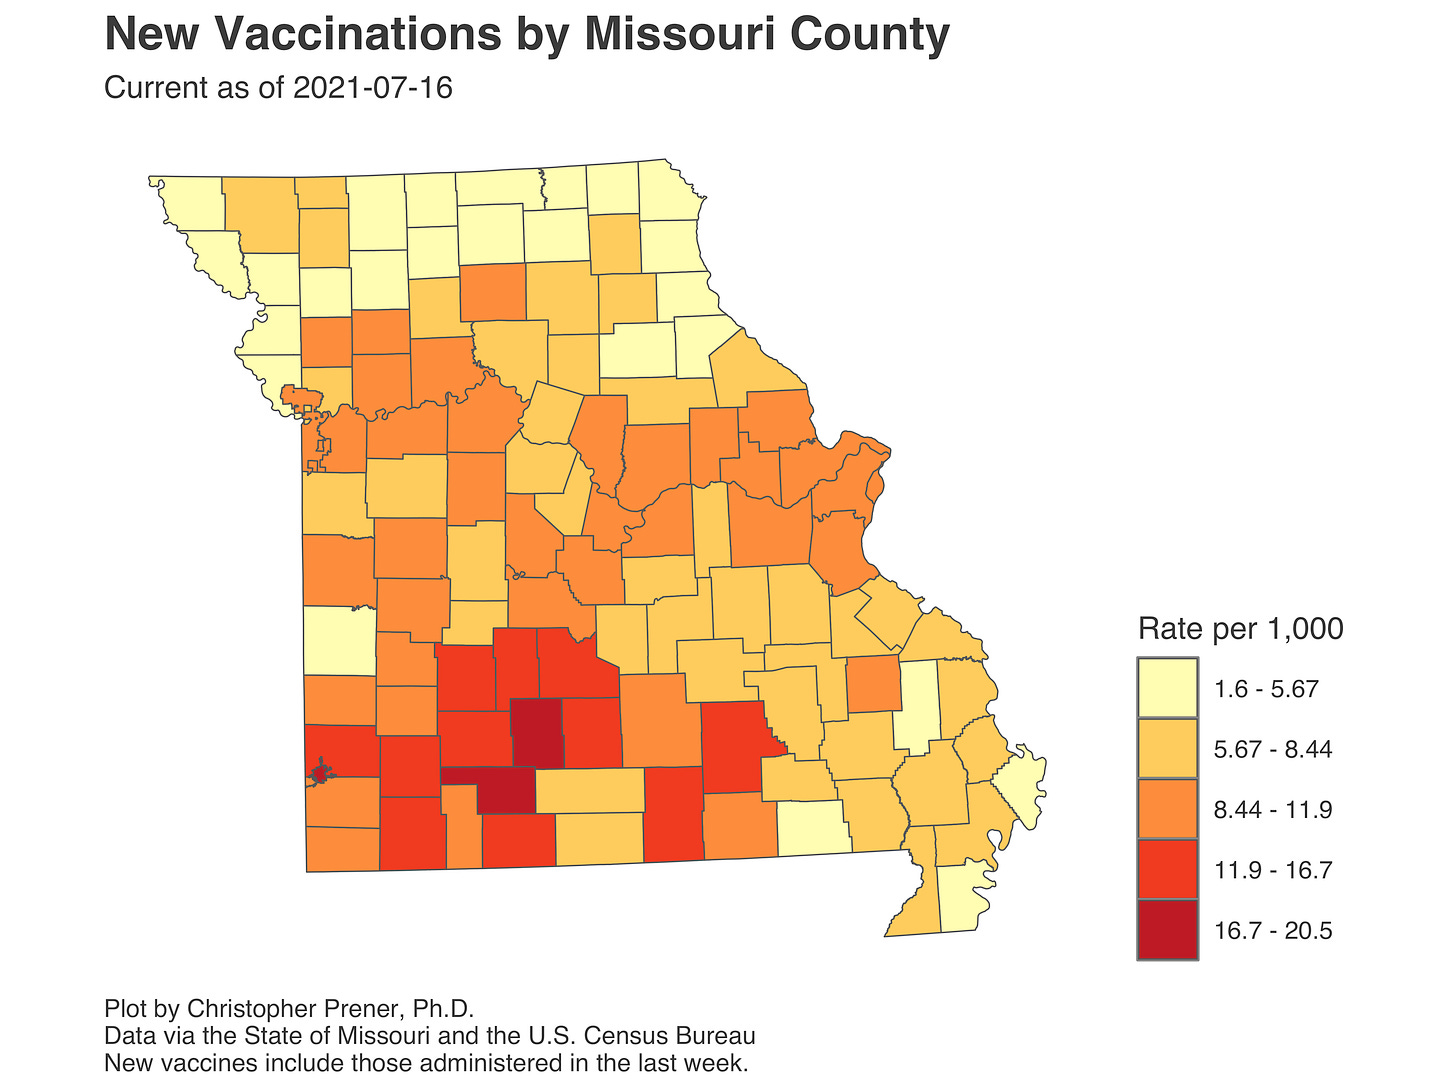
The best news of all of this is that it appears that local messages to get vaccinated immediately do seem to be having some modest effects. Around Springfield, rates of vaccinations in the last week are the highest in Missouri. This is also borne out in Young’s article in The Atlantic referenced above.
The fundamental problem, however, is that our overall numbers of vaccinated individuals remain far too low. Based on DHSS’s data, no county has reached the point where at least half its population has been fully vaccinated. I already mentioned my concerns about the Ozarks, which you can see highlighted on this map.
I’m also concerned that the City of St. Louis, and outlying parts of both the St. Louis and Kansas metros, have vaccination rates similar to Springfield. This should give all of us pause - I do not see any evidence that we have reached a point where we can avoid what is happening in Springfield from also occurring in our two largest cities. Moreover, quite a few counties in the Bootheel, Southwest, and Northern Missouri as well as around Lake of the Ozarks have similarly low rates of completed vaccination. This is our route out of the virus, and not enough of our neighbors are taking it.
If you like what you see here and don’t already, please subscribe!


