The decline in new cases I discussed last week has slowed, and the picture feels a bit murkier than it did a week ago. We have a mix of falling rates, a small number of counties experiencing spikes, and several counties experiencing plateaus. As I said last week, one of the challenges is the lack of clarity around the effect of reopening schools for the Fall on our overall picture. Tonight, I try to break some of this down below for folks. - Chris
COVID-19 by the Numbers
Total cases in MO: 761,494 (+17,492 from last Thursday)
7-day average of new cases per day in MO: 2,498.86 (-111.57 from last Thursday)
Counties with the highest per capita rates (per 100,000) of new cases per day this past week:
Carter (147.54 per 100,000), Lewis (98.31), Scott (92.58), Grundy (83.96), New Madrid (83.42), Mississippi (77.93), Stoddard (76), Atchison (75.9), Clark (71.43), and Butler (71.21)
Total deaths in MO: 11,066 (+247 from last Thursday)
7-day average of new deaths per day in MO: 35.29 (+10 from last Thursday)
Percent of all Missourians initiating vaccination: at least XX% 45% (+1% point from last Thursday)
Percent of all Missourians completing vaccination: at least XX% 38% (no change from last Thursday)
Case and mortality numbers are current as of Wednesday, August 25th. Vaccination numbers are current as of Thursday, August 26th. Additional statistics, maps, and plots are available on my COVID-19 tracking site.
Illness Trends in the Past Week
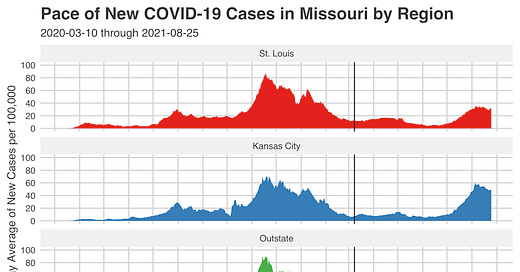
Last week, I described a transition from “ebbing cases” that had largely plateaued to falling cases. This week has been a bit of a mixed bag. In “Outstate” Missouri, the slow downward movement in the 7-day averages is continuing. In both St. Louis and Kansas City, however, we actually saw a slight uptick in the 7-day averages this week. St. Louis’s was more pronounced.
I have a few different thoughts on this pattern. First, if you look at the longer trend, you can see this momentary up and down happen even with a clearer overall trend. So, this is not surprising or on its own unprecedented. Second, while St. Louis saw the bigger bump up, it is still quite small, and the 7-day average is, in per capita terms, still well below what we see in either Kansas City or “Outstate.” Third, the upward values did not continue into yesterday, so the blip may be a temporary change.
Fourth, as the plot shows below, we have not lost that much ground in our daily volume of new cases. Yes, we are down from nearly 3,000 per day, but only by about 500 new cases. A lot of people are still getting diagnosed with COVID-19 daily here. Rates are well above where there are in Illinois, where a statewide mask mandate and sweeping vaccination requirements were just announced tonight.
The frustrating part of all of this, beyond the human toll of 2,500 new cases per day on average, is that we cannot see into the future. Not doing predictive work, which I avoid, means taking it one day at a time, even if we desperately want to know where things are headed. We also do not know what caused these increases, though the timing is curious given the return to school in many parts of Missouri.
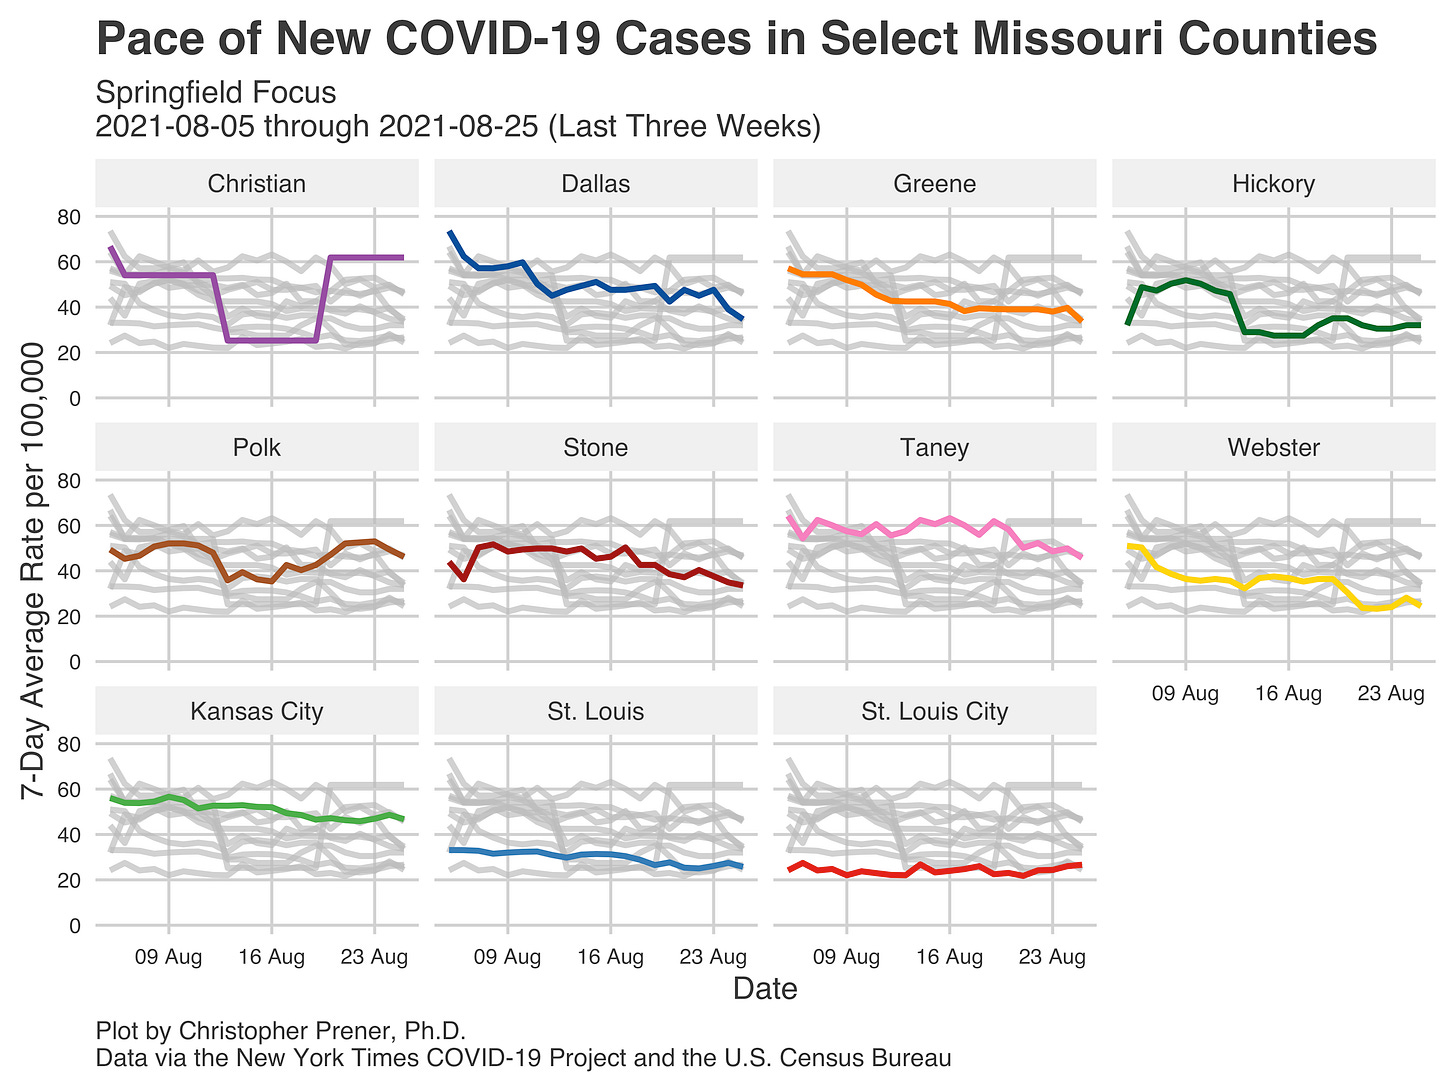
One of the bright spots among this uncertainty is that many parts of “Outstate” are seeing numbers fall away. The Springfield area is a great example of this. Excepting Christian County, whose data is reported infrequently and therefore looks a bit wonky on the plot, the slow decline I mentioned above is happening across most counties.
More concerning, though, are trends in the Bootheel. Along with some parts of the Cape Girardeau region and a handful of other counties in Northern MO, this area is seeing increases or very elevated rates in quite a few counties. It had been “passed over” earlier in our latest wave of new cases and currently is experiencing the type of jumps we saw elsewhere in June and July.
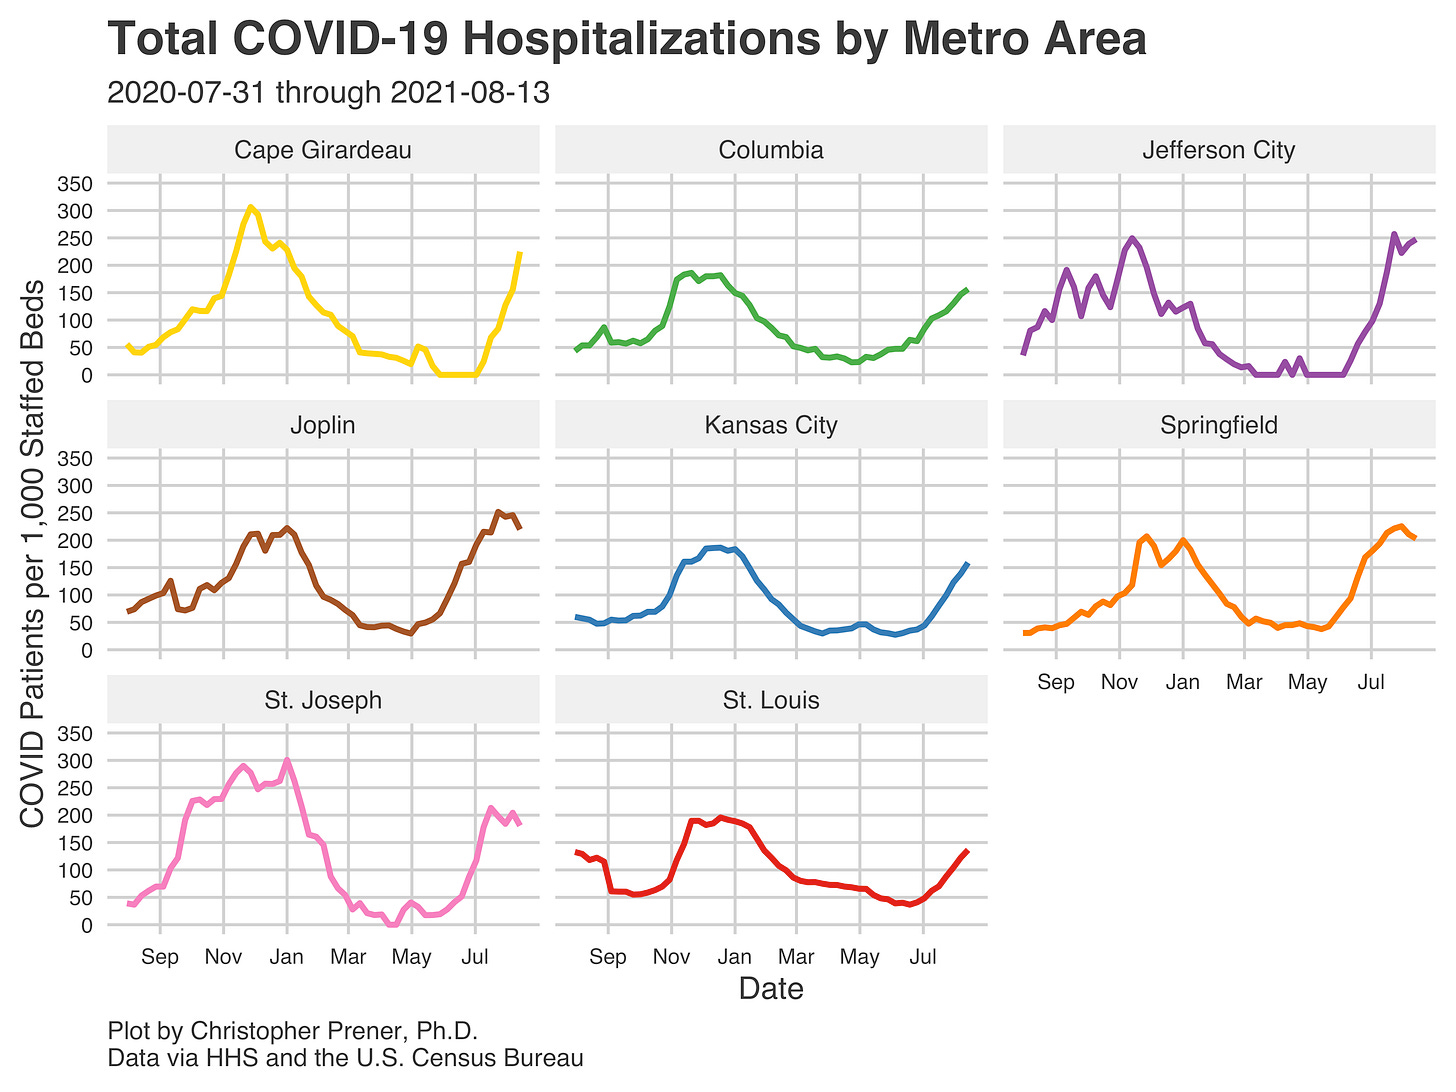
It is unsurprising to me, then, that hospitalizations are climbing in the Cape Girardeau metro area as of mid-August when they appear to have crested in the four metros that have been hit hardest so far - Jefferson City, Joplin, Springfield, and St. Joseph. An open question here is how high rates go in Cape Girardeau. During our fall and winter surge, hospitalization rates were higher than any other metro (St. Joseph was a close second). This time around, 250 patients per 1,000 staffed beds seems to be the peak for both Joplin and Jefferson City. As of the 13th, Cape Girardeau was already getting close to that number.
Though hospitalizations are rising across the board, they remain lowest in the St. Louis area despite rising significantly. I cannot help but think that the low, stable St. Louis City and County rates play a big role in this current plateau. Other counties across the metro may have flat rates, but they are much higher than we see in the urban core.
All of this also connects to the discussion I broached last week - the effectiveness of the County’s short-lived and the City’s still-on-the-books mandate. Like I said last week, we cannot establish a causal connection here, but the difference between the city and the county rates is stark when you compare it regionally or to any other part of Missouri.
Many of you may be familiar with the adage “it’s correlation, not causation.” This is true, of course - we can find many spurious associations out in the wild. A classic example involves ice cream and polio, a relationship noted in the 1940s (so the story goes) that really captures the fact that the spread of polio increased during warm weather, as did the consumption of ice cream. At the same time, however, causal relationships reflect an underlying correlation (think of the necessity of being exposed to SARS-CoV-2 as a precondition for getting COVID-19 - that’s a correlation, too!).
With the masks, we have rising case rates in both the city and the county that suddenly moderate and fall after the mandates begin. This happens at rates much lower than the surrounding area. The change is stark enough that I think there’s a very plausible association here between these rates and new cases. I can’t prove it, but honestly, I’m less interested in that than I am in why the county’s rate has remained low despite the repeal. I don’t have great answers there, unfortunately.
Vaccination Trends in the Past Week
Another area where I don’t have great answers is what we can do to drive vaccination rates up further in Missouri. The good news is that the Delta variant seems to have given Missourians a boost (pun intended) of encouragement. Our bump in vaccination rates of nine percentage points is welcome and at the higher end of the increases that the New York Times identified. This increase has pushed us over 50% in first doses, but that still puts us well behind coastal states whose rates are in the 60 or 70 percent range.
We have seen the new vaccinations map highlight different parts of Missouri over the last few months, always following where cases had recently spiked. Right now, we see the highest rates in Mid-Missouri, the Ozark Mountains, and Southeast Missouri, all places that have seen or are seeing increases in case rates.
The rates in the Ozark Mountains are particularly notable because they belie the meager rates of completed vaccinations we have seen there. Hopefully, that changes over time, but counties with completed vaccination rates between 15% and 27% will be a significant challenge if we do not see rates really pick up.
If you like what you see here and don’t already, please subscribe!


