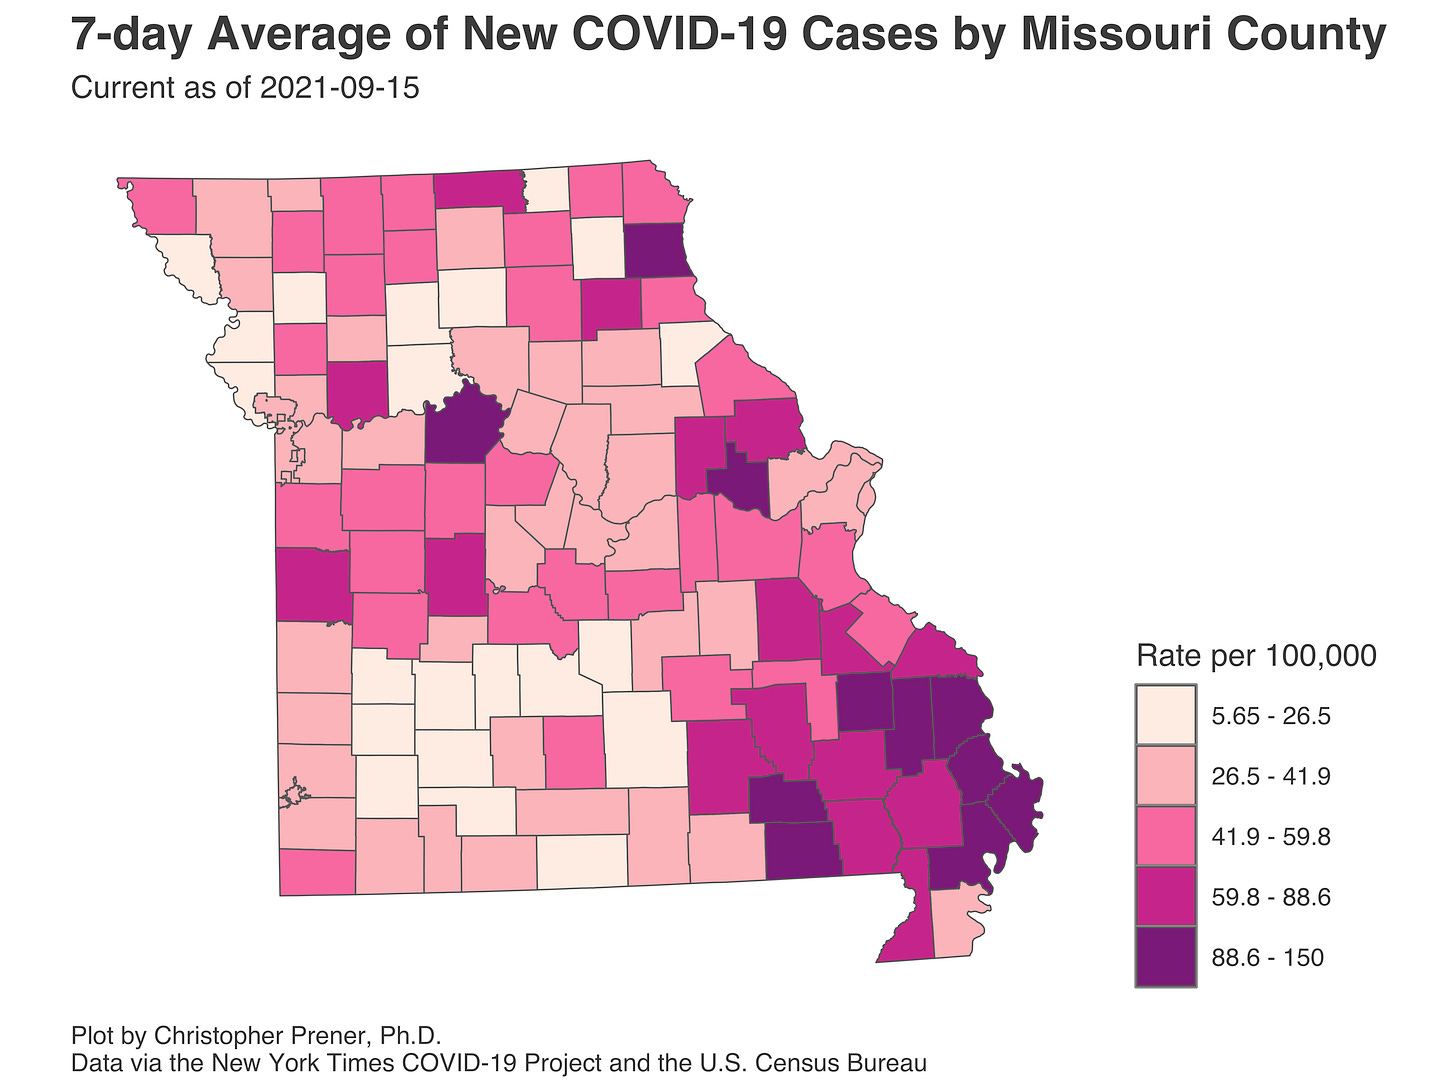
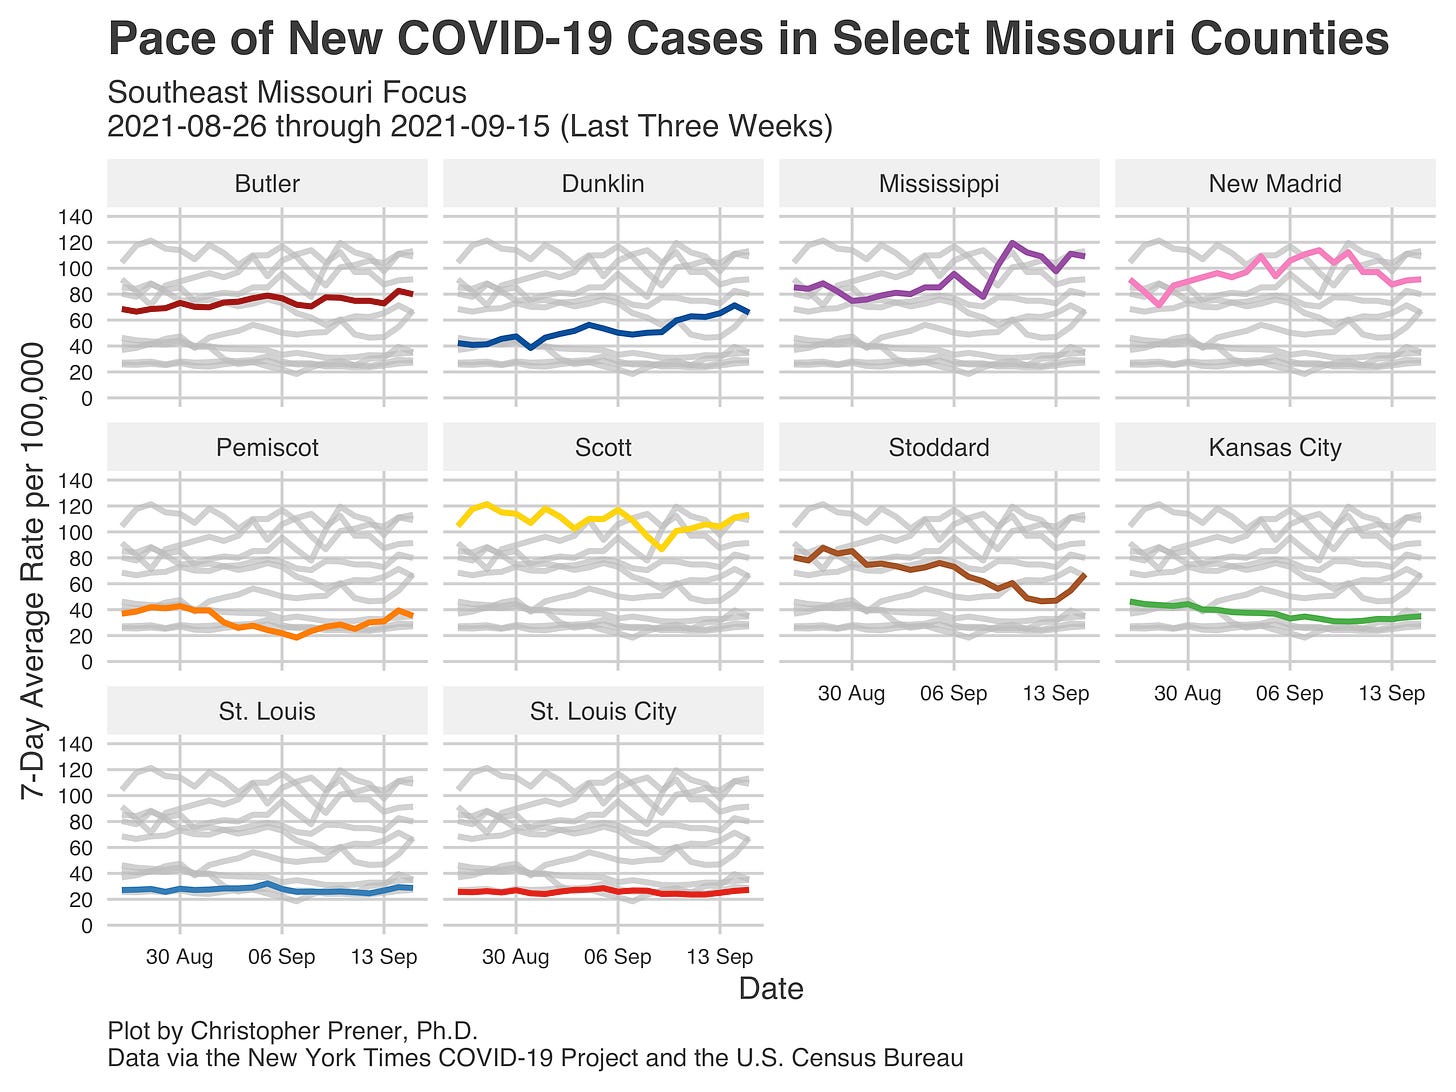
In tonight’s newsletter, I focus on the significant cluster of new cases that we see stretching from the St. Louis exurbs south to the Bootheel. This cluster is emerging as the most concerning area of new cases in Missouri right now. - Chris
COVID-19 by the Numbers
Total cases in MO: 809,525 (+16,815 from last Thursday)
7-day average of new cases per day in MO: 2,402.14 (+261.29 from last Thursday)
Counties with the highest per capita rates (per 100,000) of new cases per day this past week:
Carter (149.84 per 100,000), Scott (113.24), Ripley (111.63), Mississippi (109.11), Cape Girardeau (107.06), Saline (105.74), Lewis (101.16), Warren (99.01), Bollinger (93.06), and New Madrid (91.44)
Total deaths in MO: 11,710 (+207 from last Thursday)
7-day average of new deaths per day in MO: 29.57 (+1.43 from last Thursday)
Percent of all Missourians initiating vaccination: at least 48% (+1% from last Thursday)
Percent of all Missourians completing vaccination: at least 42% (+1% from last Thursday)
Case and mortality numbers are current as of Wednesday, September 15th. Vaccination numbers are current as of Thursday, September 16th. Additional statistics, maps, and plots are available on my COVID-19 tracking site.
Illness Trends in the Past Week
We are seeing a temporary pause in the declining case rates we experienced over the past few weeks. The break may be brief, but it comes just a few weeks after schools started and amidst widespread reporting of rising pediatric cases. The small bumps that replaced these declines are happening across all three regions. The Missouri side of the St. Louis metro is now at its highest point of the Delta surge. I should note that, when you factor in the Metro East counties, rates are below their peak. Still, it is a sign of how things have shifted in Missouri.
The shift has been profound. If you look at the list of the ten highest new case counties above, you’ll see that they are all above 90 per 100,000 per day on average. This floor is higher than we saw last week, where the floor was about 80, and higher still than the week before.
At the same time, we’ve gone from the massive cluster of cases across the Ozarks (and four states) to three notable clusters, all outside of the Joplin-Springfield corridor: a swath from exurban St. Louis to the Bootheel, the area between Lake of the Ozarks and Kansas City (especially Benton and Saline counties), and a corner of Northeastern Missouri (especially Lewis County).
The increases are so widespread that I do not want to include every trend line. You can see all of these plots on my website. Instead, I will focus on the largest cluster of cases from St. Louis south to the Bootheel. While St. Louis City and County have rates that remain pretty low, all of our neighbors are seeing increasing trend lines. The most modest increases are in Franklin, Jefferson, and St. Charles counties. Warren and Lincoln counties are experiencing far more severe spikes in new cases.
To the south, around Cape Girardeau, we also see spikes in a host of counties. Iron and Crawford counties are the outliers here - every other county has had some degree of increase in recent weeks. The sharpest increase is in Cape Girardeau County, which has seesawed up and down over the past six weeks.
Continuing south to the Bootheel, the pattern is much the same. Continued increases in most counties, including upticks in Pemiscot County, where rates remain pretty low. Mississippi and New Madrid counties are both on the list of the ten most affected counties in Missouri.
Finally, to the west in the Ozarks, the pace of new cases in Carter, Reynolds, and Ripley counties is notable. Keep in mind the following plot’s y-axis has a much wider range than the plots above. So, Shannon County, for example, looks like it is not so bad on this plot, but its rate is still relatively high.
All of these increases are going to have impacts on the hospitalization rates in Cape Girardeau. While they were declining as of the beginning of September, that may change as we get more data over the next two weeks.
My concerns for St. Louis are similar to Cape Girardeau - the increases we see in both metros, but especially St. Louis, are concerning enough that we might expect the declines occurring in in-patient numbers to pause. However, what is better news is that hospitalization rates continue to decline in Jefferson City, Joplin, Springfield, and St. Joseph.
Vaccination Trends in the Past Week
I do not have much news on vaccinations - new immunization rates continue to decline across the state. One immediate concern is that the area most profoundly impacted by new cases - around Cape Girardeau, the Bootheel, and some Ozark counties - continues to have lower rates of completed vaccination. As long as Missouri’s vaccination rates continue to be middling at best and significantly lower in certain areas, I fear we will continue to struggle to move past this latest acute phase of the pandemic.
If you like what you see here and don’t already, please subscribe!


