Last week’s issue marked 18 months of my COVID tracking work, and I’ve been reflecting on where this project goes from there. I’ve got students contributing to its infrastructure and some new data visualizations this year, and I’m planning to maintain the site through next May, which will be twenty-six months after the project began in March 2020. However, how this unfolds is very unclear.
After I provide a brief update below (lots of tentatively good news!), I’ll get into some of the factors that are already limiting my ability to continue reporting data. The concise summary is that I may not be able to continue reporting trends through next May. In the meantime, I also am increasingly feeling the weight of nightly data work. I’ve missed just one day since March 24, 2020, when I drove 15 hours to upstate New York in May 2020.
To sustain nightly updates to the website through May, I plan to cut down the amount of time I spend troubleshooting specific ancillary data sources and will be more likely to cut off reporting as issues arise. I anticipate shorter Thursday newsletters and little tweeting about COVID trends outside of a short update on Tuesday. I appreciate folks’ patience and understanding with these changes! - Chris
COVID-19 by the Numbers
Total cases in MO: 835,380 (+11,739 from last Thursday)
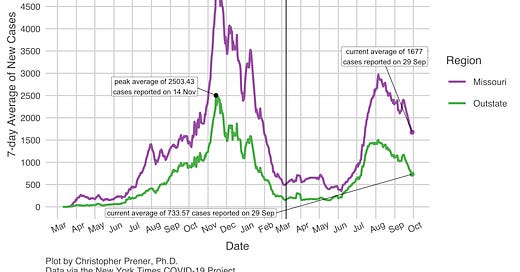
7-day average of new cases per day in MO: 1,677 (-339.57 from last Thursday)
Counties with the highest per capita rates (per 100,000) of new cases per day this past week:
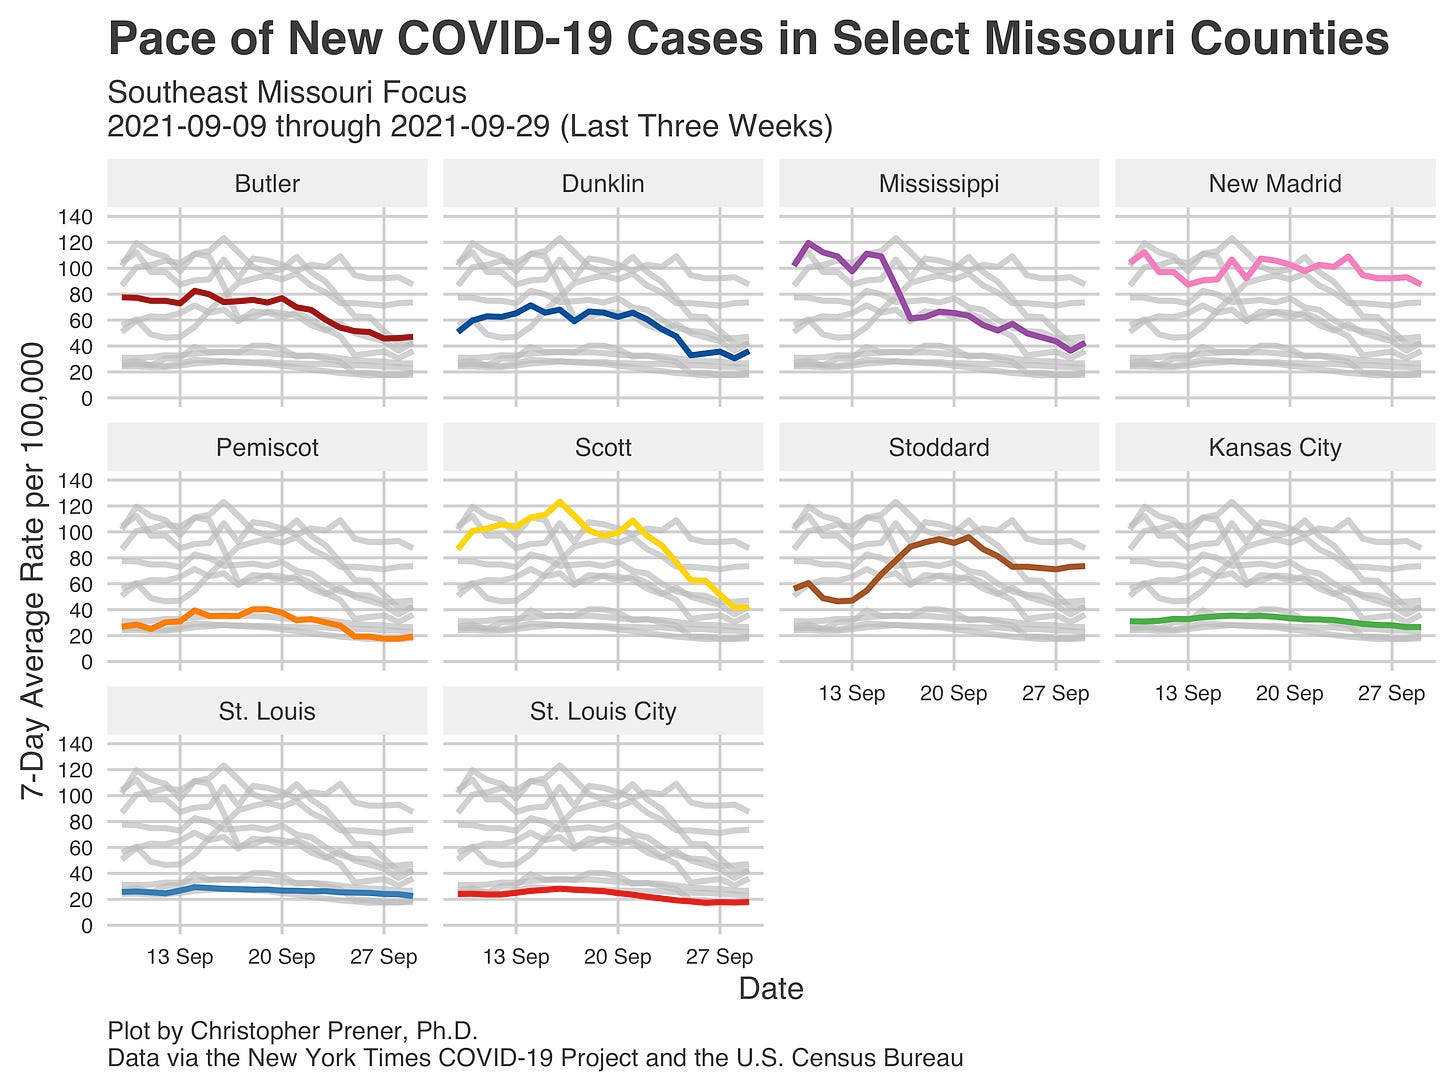
Gentry (156.47 per 100,000), New Madrid (87.43), Stoddard (73.58), Ripley (70.94), Bollinger (61.65), Lincoln (57.85), Warren (56.46), Perry (50.74), and Benton (50.41))
Total deaths in MO: 12,179 (+208 from last Thursday)
7-day average of new deaths per day in MO: 29.71 (-7.57 from last Thursday)
Percent of all Missourians initiating vaccination: at least 49% (+1% from last Thursday)
Percent of all Missourians completing vaccination: at least 43% (no change from last Thursday)
Case and mortality numbers are current as of Wednesday, September 29th. Vaccination numbers are current as of Thursday, September 30th. Additional statistics, maps, and plots are available on my COVID-19 tracking site.
Trends in the Past Week
The overall trend in Missouri is quite reassuring, even if we still have a long road ahead of us. Our steady decline in new cases statewide has accelerated over the past couple of weeks. If this continues on pace, we will see half as many new cases daily next week as we did in early August when our Delta surge peaked. Moreover, much of these declines are coming from “Oustate” areas of Missouri.
In comparison, St. Louis is not experiencing the same degree of decline. Case rates are dropping, but not at the same pace. As a result, per capita rates across the three “meso” regions are now basically equal to each other - between 26.7 and 28.7 new cases per 100,000 people per day.
At a more granular level in St. Louis, what is happening is a very slow drop in new cases in most counties. This decline is welcome, but it is not as extreme as the declines we see elsewhere in the state. We also saw our case rates peak less abruptly and later than other parts of Missouri. Therefore, I would anticipate that it will take longer to see the significant declines experienced elsewhere. At some point, the St. Louis region will likely lead Missouri in new cases because of this, even as rates decline.
There are two areas I am watching “Oustate,” despite the good news. The first is in Northwest Missouri, where Gentry County is experiencing a pronounced spike in new cases. Like other Delta spikes, the height of this spike is comparable to Gentry County’s prior new case rates last fall.
The other area I am watching is the Bootheel. New Madrid and Stoddard counties are areas of particular interest because we do not see the declines we see elsewhere in the region, such as Mississippi and Scott counties.
Other than these outliers, however, the picture continues to improve across the board. I will say that few counties have returned to their pre-Delta spike numbers from last May. This drop to very low new case rates may take far longer in the fall to achieve, or perhaps even into early 2022 in some cases if we see another resurgence in new cases. Time will tell.
In the meantime, we also have good news for hospitalizations, where rates are falling alongside declining numbers of new cases around Missouri. Some are slight so far, including in St. Louis, and as of mid-September, there was still significant pressure on hospital systems across Missouri. However, I anticipate that this eases substantially by mid-October, following the trajectory Jefferson City is on.
Where We’re Headed
It is becoming increasingly apparent that we’re likely to see changes in the data landscape in the next six months. There are two open questions I’ve got top of mind right now. The first is whether we see a spike in new cases this fall. Last year, new cases jumped in early October and then climbed steeply in November. I would not be surprised to see at least some resurgent levels of new cases in Missouri in the next two months, but I also would not be surprised if this paled in comparison both to last fall and our Delta spike this summer.
Suppose we have weathered the next three months along those lines (or even without a spike). In that case, the second open question is how long local health departments, the St. Louis Pandemic Task Force, DHSS, and federal partners continue to report data. I would not be surprised if local health departments and entities like the St. Louis Pandemic Task Force have backed out of reporting by early next year. Likewise, I wonder how long the New York Times will continue to dedicate reporters to curating their data, especially into 2022.
We’re already starting to see signs that the data status quo is changing in St. Louis. Warren County stopped reporting local data altogether, and both Jefferson and St. Charles counties have stopped cumulative cases at the ZIP code level. Platte and Jackson counties over in Kansas City have done the same.
On the one hand, this reflects a reprioritization of staff to other more pressing tasks. That’s reassuring in a sense - we are getting to a point where the cost-benefit of maintaining dashboards is becoming less clear. This change is what the pandemic “ending” (though we’ll be living with COVID to some degree for years to come) will be like. Not going out with a bang, but with the whimper of unmaintained dashboards and a gradual easing of our remaining masking and non-pharmaceutical interventions. These changes are good signs, even if it feels like we’re still in the throes of the pandemic right now.
However, as this process continues, it will eventually cripple my ability to provide data and analysis about the pandemic. This effect is because I rely almost exclusively on data being posted publicly by these various agencies and the New York Times. I think it is very likely that, even if I can continue to rely on the New York Times through May, local data sources will stop being updated, and I will begin to pair back maps and plots on the site that rely on them this winter and next spring.
Moreover, while I anticipate nightly updates to the website continuing through May 2022, we may hit a point where it is simply no longer feasible to do this. But, again, the New York Times will be the deciding factor there. If their data project ends sometime next spring, I cannot see a path forward to May without them.
If we do make it to May, I plan to suspend updates to the site at that point and take an extended break once the semester ends from work, social media, and the data work that has consumed my evenings. In the meantime, I plan to scale back the length of my newsletters and the frequency of tweets about COVID. I appreciate everyone joining me on this journey over the last year of newsletters and the previous year and a half of data reporting. I’m grateful for your engagement and questions, and am looking forward to continuing on this adventure with you all over the next eight months.


