In tonight’s newsletter, I recap my continued concerns about new case rates in “outstate” Missouri and share a glint of good news about vaccinations. Finally, I share two media reports from today about HIV/AIDS and sexually transmitted illnesses that both demand our attention. - Chris
COVID-19 by the Numbers
Total cases in MO: 619,640 (+3,440 from last Thursday)
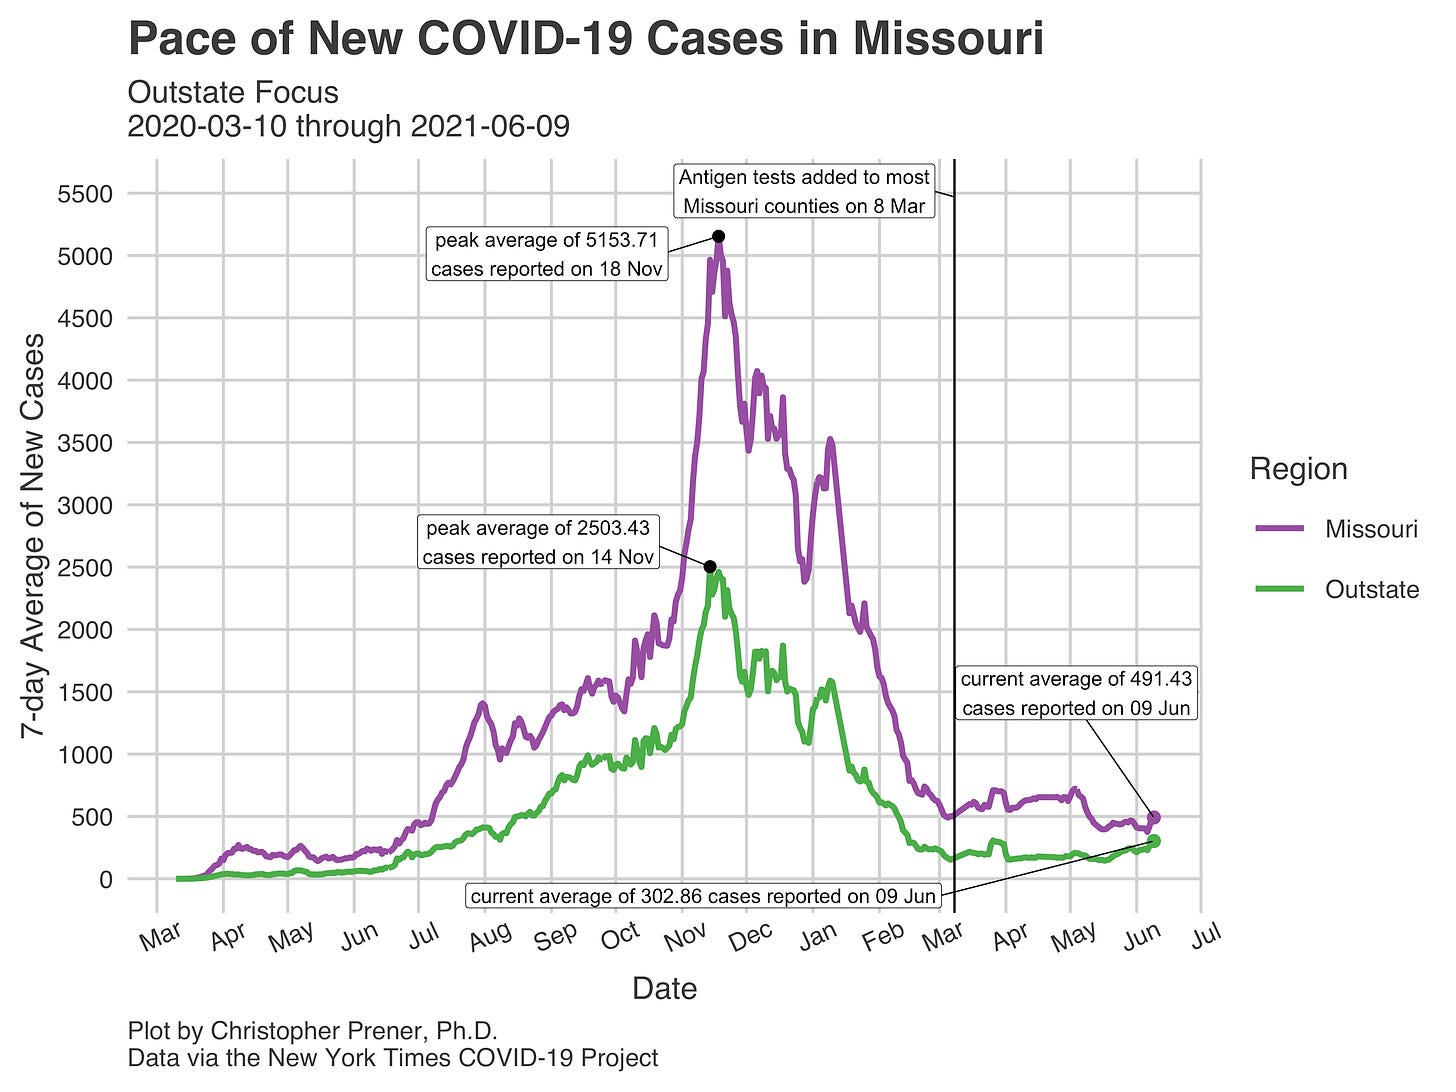
7-day average of new cases per day in MO: 491.43 (+86.57 from last Thursday)
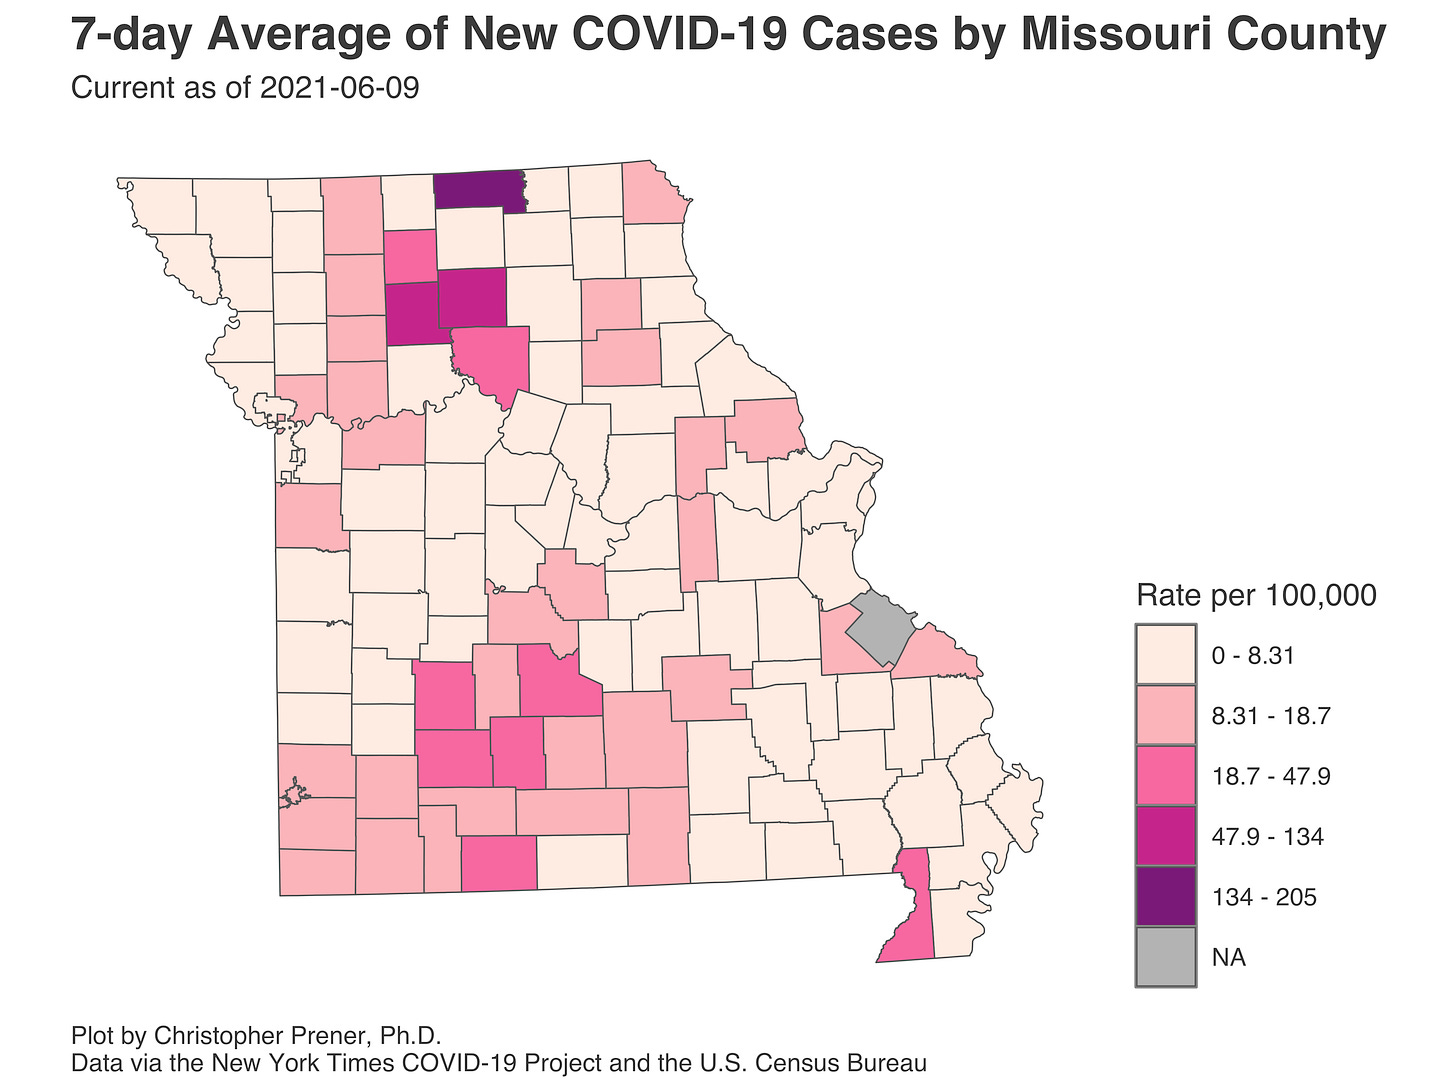
Counties with the highest per capita rates (per 100,000) of new cases per day this past week:
Putnam (204.72 per 100,000), Livingston (62.54), Linn (59.79), Chariton (35.97), Taney (30.55), Grundy (27.04), Webster (25.13), and Greene (23.23)
Total deaths in MO: 9,780 (+70 from last Thursday)
7-day average of new deaths per day in MO: 10 (+1.71 from last Thursday)
Percent of all Missourians initiating vaccination: at least 38% (+1% point from last Thursday)
Percent of all Missourians completing vaccination: at least 32% (+1% point from last Thursday)
Case and mortality numbers are current as of Wednesday, June 9th. Vaccination numbers are current as of Thursday, June 10th. Additional statistics, maps, and plots are available on my COVID-19 tracking site.
Illness Trends in the Past Week
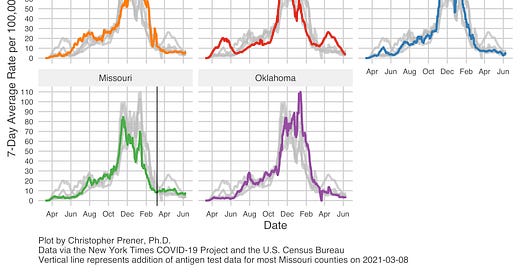
This week’s trends continue to be concerning. Missouri has the highest per capita rate of new cases at the state level among the five states that I track closely. Nationally, we have the sixth-highest rate of new cases per capita among states (we’re ranked seventh if you count territories, with the U.S. Virgin Islands’ rate eclipsing all other jurisdictions).
If you look at the trends above, it does not seem like Missouri is in bad shape relative to where we had been this past fall and winter. That is true, but two things have changed recently. First, many other states have had their rates fall away from Missouri’s. So, our rate of new cases may be low, but many other states have fallen lower. Second, a selection of counties in “outstate” Missouri have seen significant increases in the number of new cases they are experiencing.
The underlying shifts pushing this trend are concentrated in the two areas of the state I highlighted last week: groups of counties in Northern Missouri and Southwestern Missouri.
Putnam County, the county in dark purple on the map, is currently experiencing all-time high numbers that mean it is the jurisdiction with the highest per capita rates in Missouri. These numbers are so high, in fact, that Putnam County also has the highest per capita rate of new cases in the United States. As you can see below, it is trending upward as well.
I have a slightly more focused plot to share tonight showing these same counties but over just the last three weeks. Not only does it highlight Putnam’s significant bump in new cases, but also some slightly good news - cases are declining again in Livingston County and are flat in Linn County. The good news is only slight because, even with their lower rates, these two counties are numbers five and six nationally for their per capita rates of new cases among counties with at least 10,000 residents. Meanwhile, you can see that surrounding counties like Adair, Macon, Randolph, and Schuyler have had their trends stay basically flat and near zero over the past few weeks.
Meanwhile, in Southwestern Missouri, Polk County has been the jurisdiction to watch. However, they report data sporadically - it only registers with the New York Times data set three or four times a week - and so as of yesterday, their rate of new cases had actually dropped below 20 cases per 100,000 people per day on average. Instead, it is Taney, Greene, and Webster counties that now are headed upwards. I would not be at all surprised to see Polk’s rate climb again, but we will have to wait and see.
Outside of the counties on this plot, I am concerned about a host of counties around Joplin (including Joplin itself as well as Jasper and Newton counties), Texas County in the Ozark Mountains, and Laclede County to the northeast. In that area near Laclede County, I am also watching trends start to tick upward in Camden, Miller, and Pulaski counties. However, these three counties’ rates are still quite low at this stage.
The hospitalization data we have access to through HHS is lagged several weeks, but note the upticks in Columbia, Joplin, and Springfield metros by the end of May. This is important because these three metros are the closest to the areas of concern I’ve outlined. Therefore, I will be watching those metros’ trends closely over the next few weeks.
Two of these metros, Joplin and Springfield, are experiencing upticks in new cases as well. This makes me think that Columbia’s increase in hospitalizations may be driven by cases outside of the metro area itself (perhaps from counties to the north).
Vaccination Trends in the Past Week
There is a bright spot on vaccinations, where rates in MSHP District C actually have moved upward from their recent lows. The increases are particularly notable in Districts C (St. Louis), A (Kansas City), F (Columbia and Jefferson City), and D (Southwest MO).
In these four areas, higher vaccination rates are especially concentrated in the most urban counties. For example, Greene and Joplin City have the highest rates in District D, and Boone County has the highest rates in Region F. In both the St. Louis and Kansas City metros, the cities themselves and inner suburbs (Jackson County in KC and St. Louis and St. Charles counties in STL) are really driving these trends.
That said, our vaccination pace remains precarious. While our statewide rate of new cases is among the highest in the United States, our vaccination pace is among the lowest. Missouri ranks 39th in terms of the share of adults receiving at least one dose. We are, therefore, well below the national vaccination rate. As I said last week, I remain most worried about counties south of I-44 in the Ozarks, where immunization rates are the lowest in Missouri and case rates have been relatively low as well.
Into the Weeds
I strongly encourage folks to watch PBS Newshour’s coverage of the 40th anniversary of the initial identification of what would become AIDS. Among the most important messages is that African Americans’ rates of HIV remain especially concerning, making up more than 40% of newly identified infections. Like with COVID, the AIDS epidemic is also a question of racial justice.
Friend of the newsletter, Dr. Hilary Reno, was also on St. Louis On the Air today speaking about the intersection of COVID and sexually transmitted infections. I had the privilege of interviewing her a few months ago.
Please check these two important reports out!
If you like what you see here and don’t already, please subscribe!


